Organization Dashboard
The Organization Dashboard gives you a single view of your security across all projects. Instead of checking each project separately, you can quickly understand risks, track progress, and prioritize actions in one place.
Accessing the Dashboard
- Go to: Dashboard → Organization Dashboard
- By default, the dashboard shows data for all projects you have access to.
- You can:
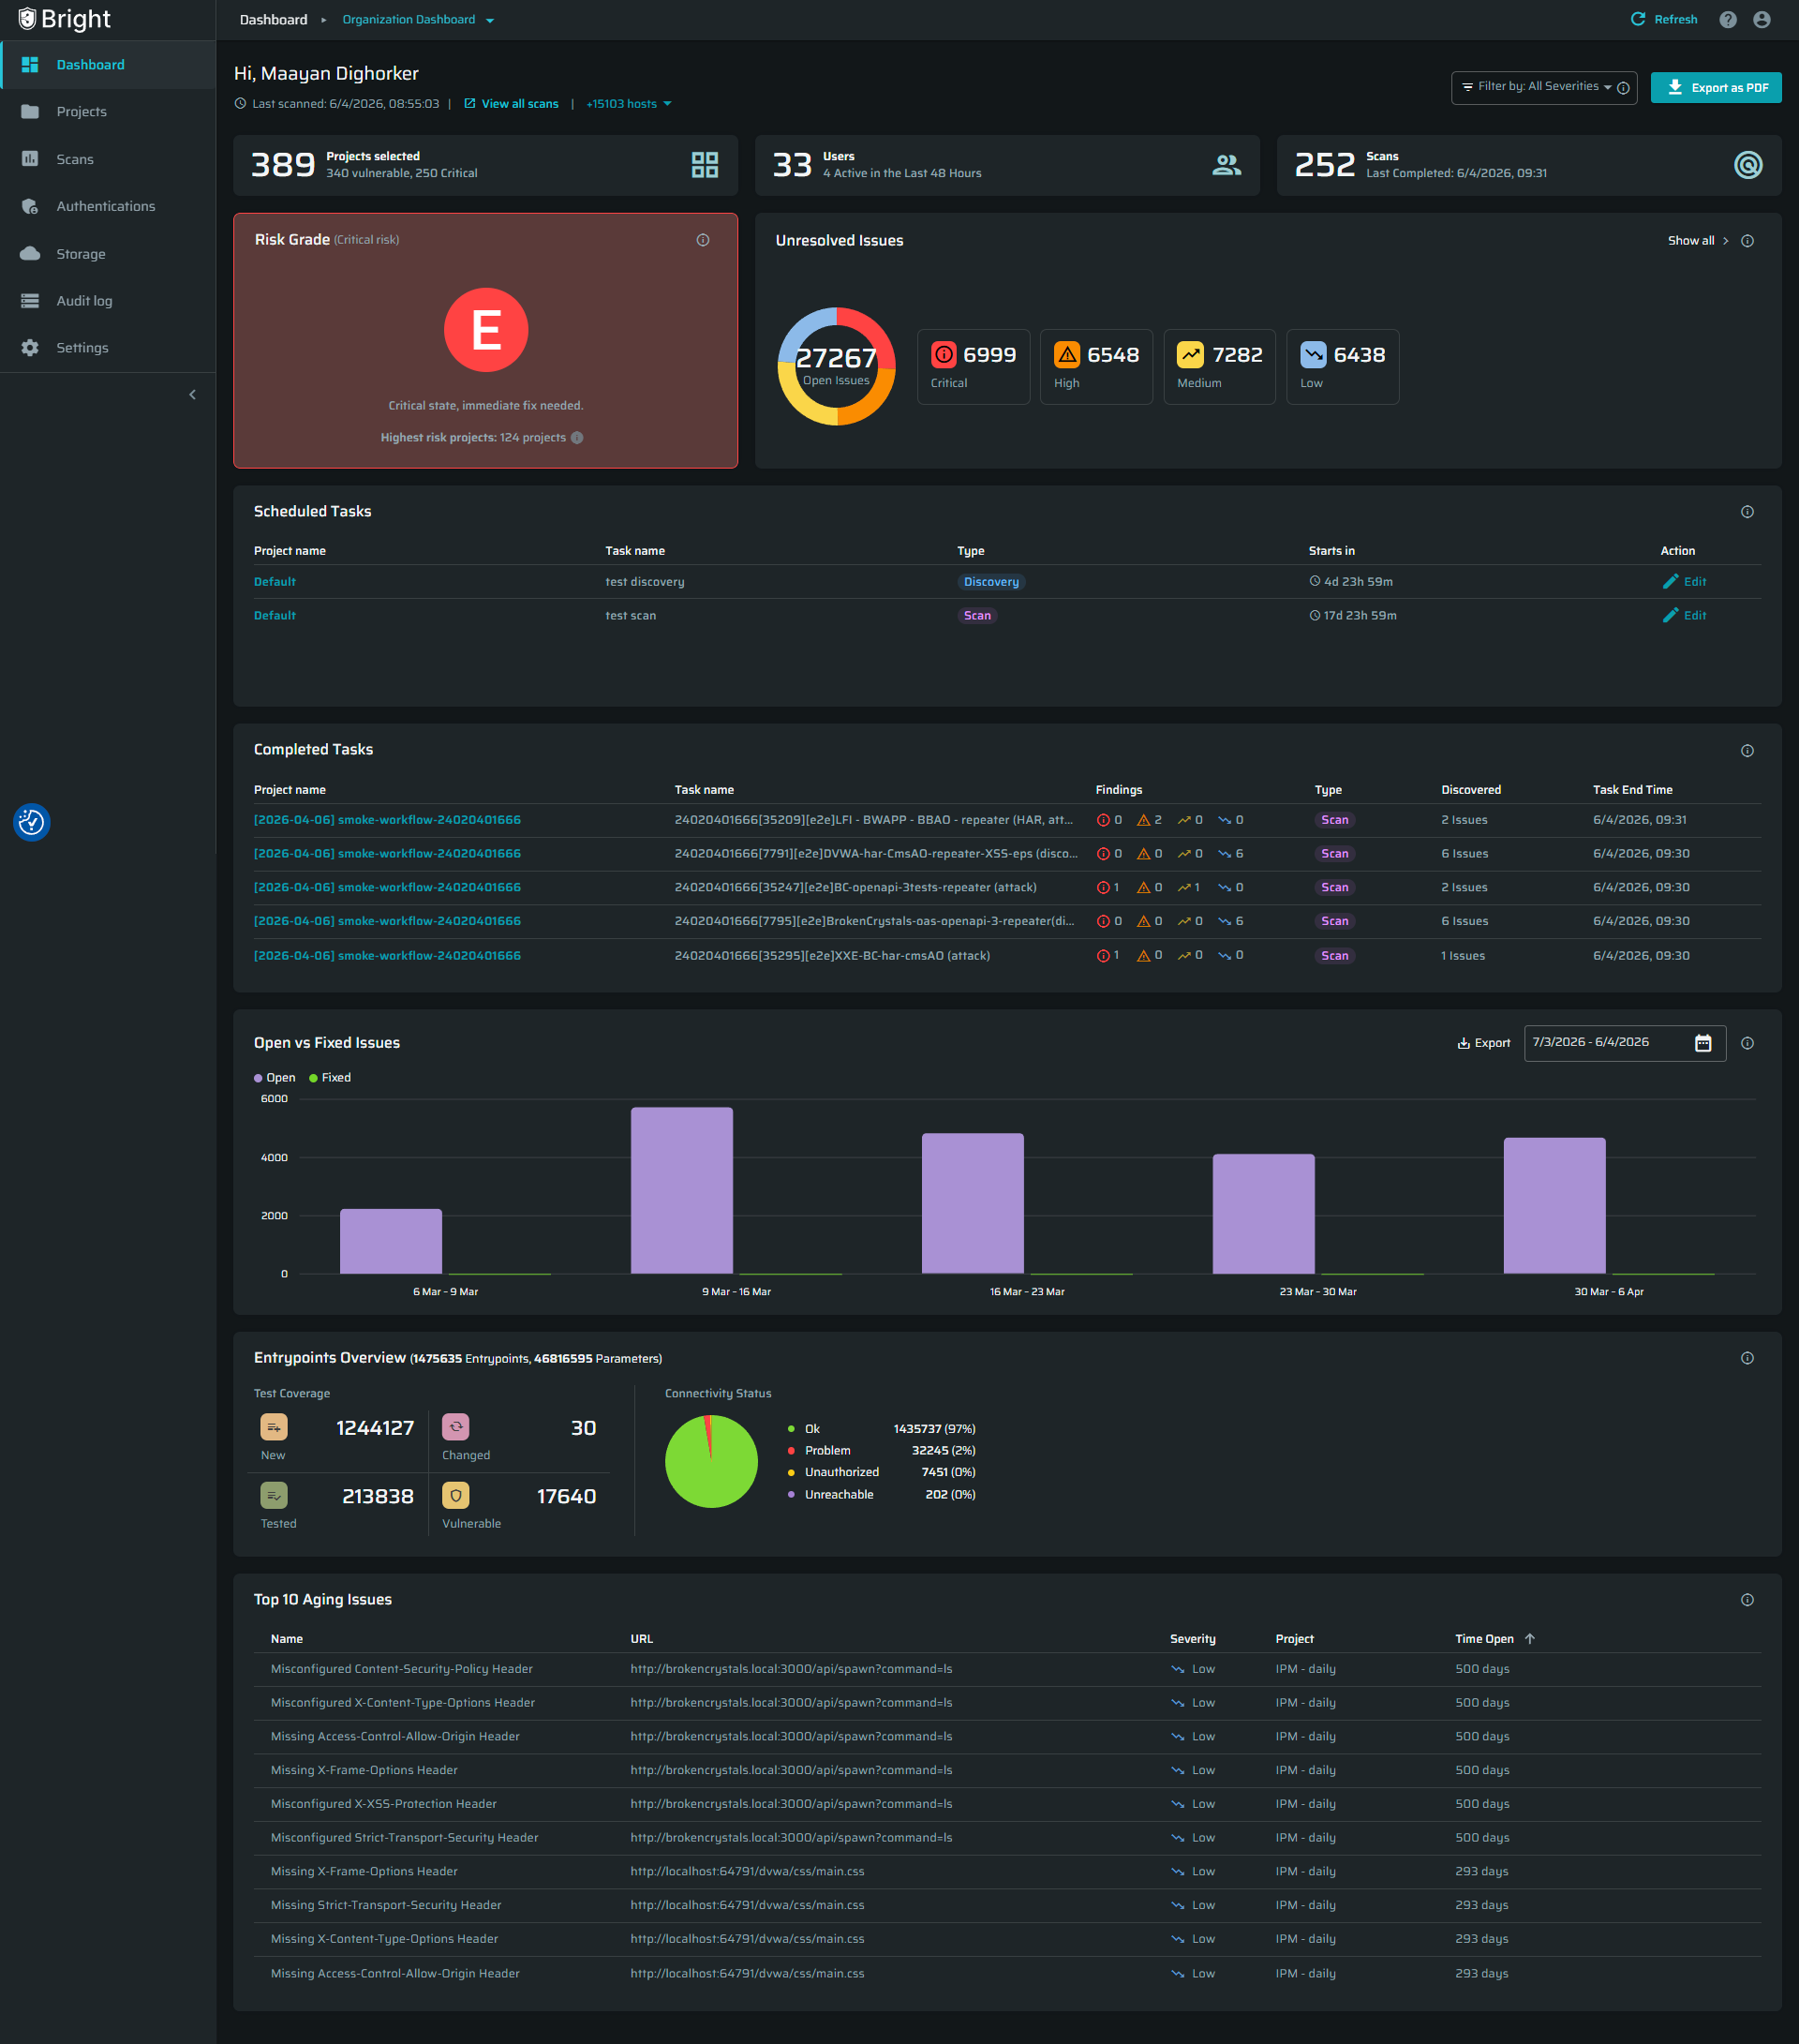
- Select specific projects using the project picker
- Search by project name or ID
- Select multiple projects
Your project selection is saved, so next time you open the dashboard, it will load the same view.
Permissions and Access
- All users with project access can view their project in the dashboard.
- To view the Dashbaord you need the following scope:
project:Read
Data Refresh and Update Behavior
Dashboard data updates automatically following every completed scan. If no new scan data is available, widgets will display the latest available snapshot.
Notes
- Data is based on the latest available scans
- Different projects may have different scan times
- Always check the Last Scan Date for accuracy
Dashboard Widgets
1. Projects Overview
This section shows 3 key metrics:
Projects - total selected projects, including how many are vulnerable or critical
Users - total users and active users in the last 48 hours
Scans- number of scans in the past 30 days and the last completed scan time
Use this section to quickly understand activity and coverage.

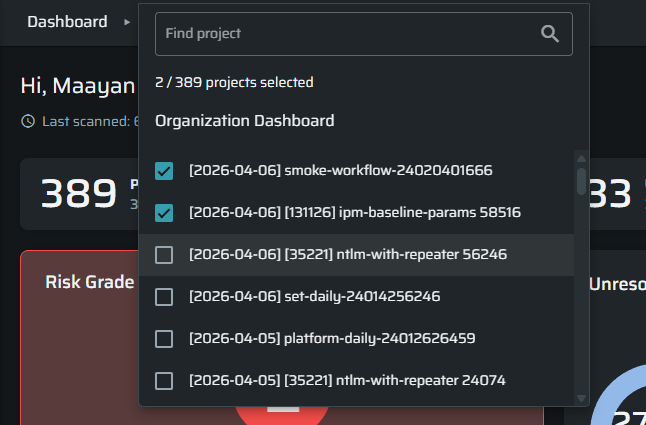
2. Security Grade (A-E)
This shows your overall security posture across several projects
It is automatically calculated based on the number and severity of unresolved Issues (CVSS) detected across the projects.
The grade reflects the worst (highest risk) project in the selected scope. Click the info icon in the widget to view the highest-risk projects.
- A - Excellent Indicates minimal security risk. The projects contains very few or no open Issues. Any issues that were detected are low-severity and were remediated quickly. Reflects a strong, proactive security posture.
- B - Good Represents a generally healthy security status. Some medium-severity issues may still be open, but the overall risk exposure remains controlled.
- C - Moderate Shows the presence of noticeable Issues across multiple components. Typically includes a mix of medium and high severity issues. Requires focused remediation to prevent escalation.
- D - Poor Indicates outstanding high-severity issues and delayed or limited remediation activities. The projects' security posture is weakened and needs immediate attention.
- E - Critical Reflects severe, widespread Issues and significant security debt. Exposure is high and requires urgent remediation to restore acceptable security levels.
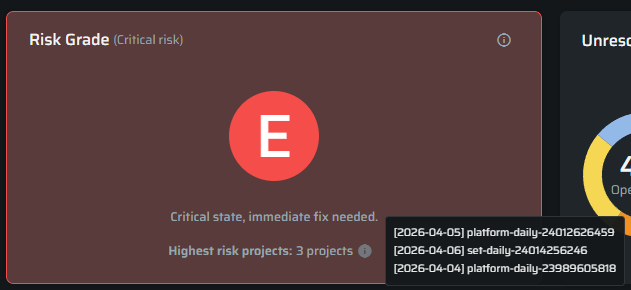
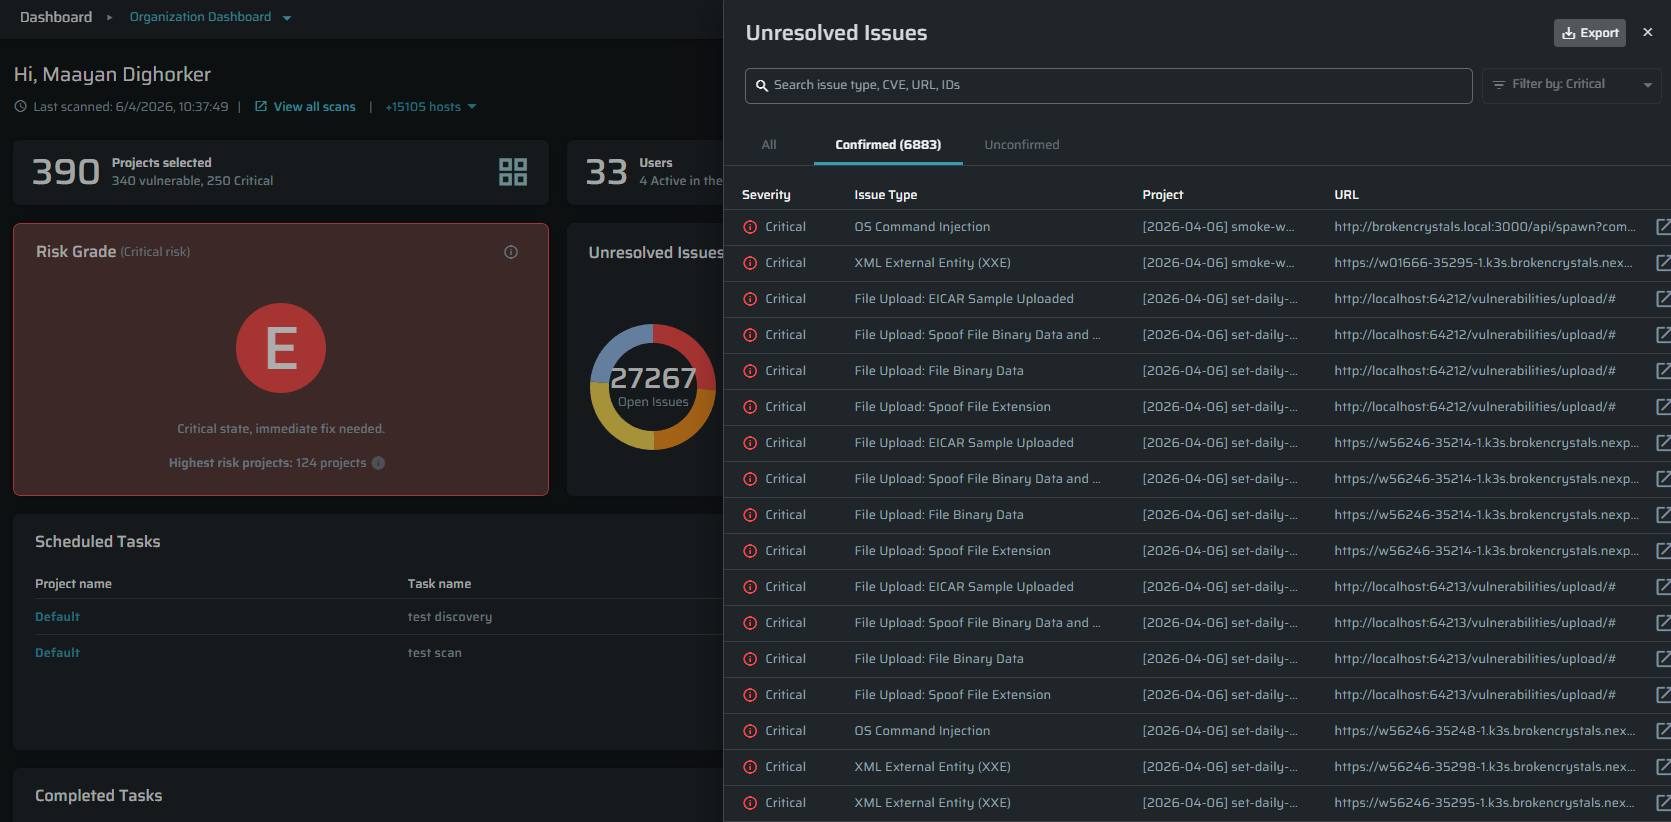
3. Unresolved Issues
This widget shows all open issues across your selected projects.
It includes:
- Total number of unresolved issues
- Breakdown by severity (Critical, High, Medium, Low)
- Visual donut chart with percentage breakdown
This helps you understand where your biggest risks are.
You can click on a severity or the chart to open a detailed list of issues.
Inside the table, you can search or filter by:
- Project name or ID
- Issue name of ID
- URL
- Issue type
- Severity level
Clicking on an issue will lead to the issue details page
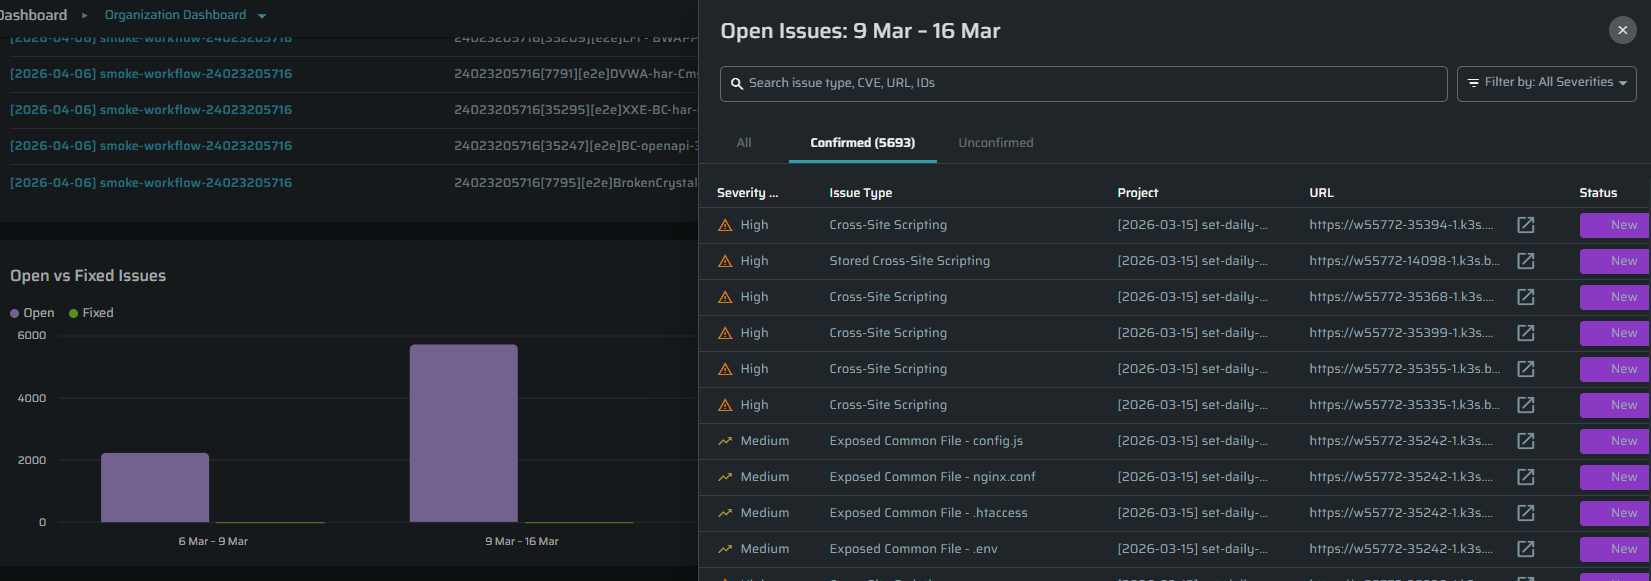
4. Open vs Fixed Trend
This chart shows how your Issues change over time.
- Open issues vs fixed issues
- Weekly, monthly or yearly view (based on time range)
- You can click the chart to see detailed data.
- Inside the table, you can search or filter by:
- Project name or ID
- Issue name of ID
- URL
- Issue type
- Severity level
- Inside the table, you can search or filter by:
Use this to understand if your security posture is improving over time.
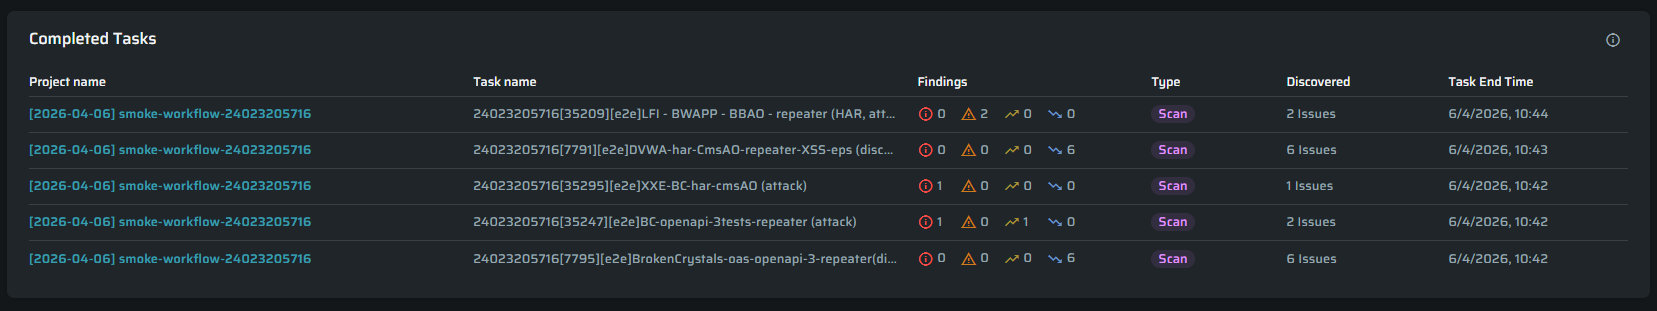
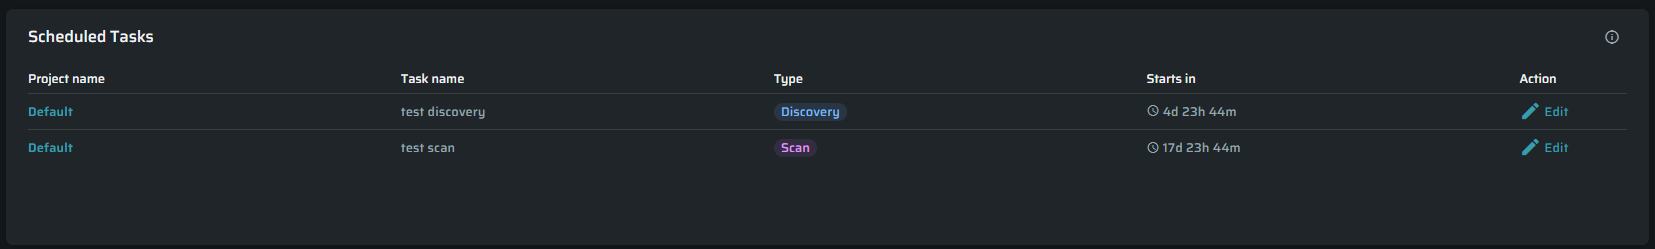
5. Scheduled & Completed Scans
This section shows scan activity across projects. Use this to track execution and coverage of your scans.
Completed tasks:
Shows which tasks were already completed for the selected projects.
The table includes the following details:
- Project name
- task type (Discovery/Scan)
- Number of Issues or entrypoints found
- Severity breakdown
Clicking on the project name will lead you to the project details page.
Scheduled Tasks:
Shows which tasks are scheduled for the selected projects.
The table includes the following details:
- Project name
- Task name
- Type (Discovery/Scan))
- Countdown
Clicking on the project name will lead you to the project details page
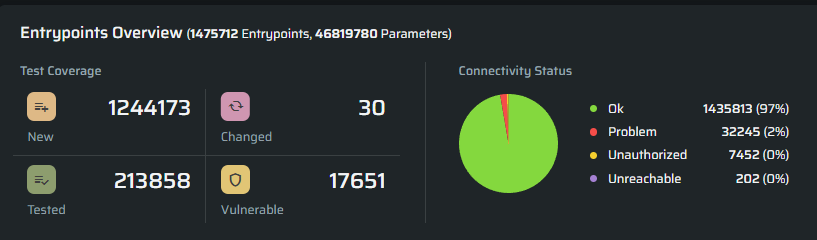
6. Entrypoints Overview
This widget shows the health of your scanned entrypoints.
It includes:
- New, changed, tested, and vulnerable entrypoints
- Connectivity status (OK, problems, unreachable, etc.)
This helps you understand what is being tested and where there are gaps or issues
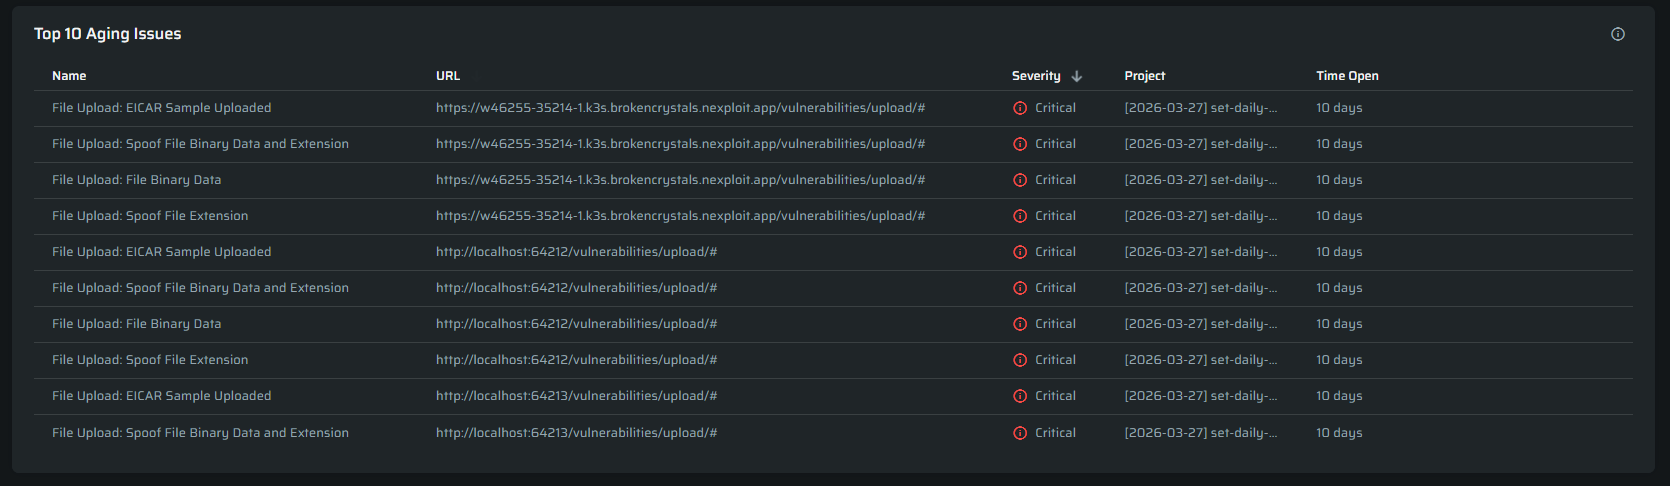
7. Top 10 Aging Issues
These issues represent security debt and should be prioritized across all selected projects.
These are Issues that have been open for a long time and may require attention.
Use this to identify security debt and prioritize fixes.
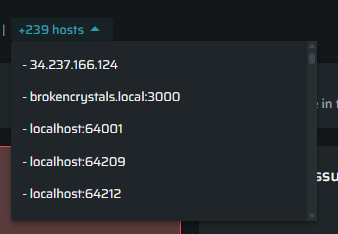
Viewing the hosts
To see the hosts that are associated with the selected projects, click on the “hosts” button.
Exporting Data
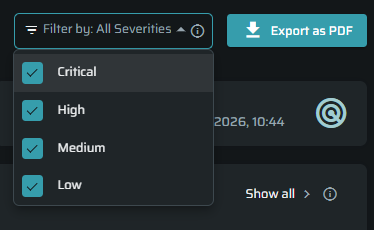
- The entire dashboard view can be exported as a PDF snapshot for reporting and sharing
- Exports reflect current filters and date ranges.
- Some widgets can be exported as CSV.
- Unresolved Issues
- Open vs Fixed Issues
- Exporting data (CSV/PDF) requires
project.reports:read.
Filters
Project selection controls which projects are included
- Severity filter updates all widgets
- All data on the dashboard is affected by these filters
Updated 3 months ago