Dashboard Severity Filter
The Severity Filter allows you to focus the dashboard on specific risk levels.
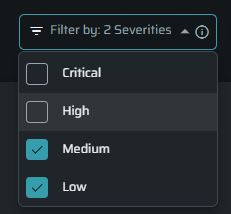
Instead of viewing all data together, you can filter the dashboard to show only:
- Critical
- High
- Medium
- Low
This helps you quickly prioritize and analyze the most important issues.
How to Use
- Click the Severity Filter dropdown at the top right corner of the dashboard
- Select one or more severity levels
- The dashboard will automatically update
You can select:
- A single severity (for focused analysis)
- Multiple severities (for broader view)
- To reset, select All Severities.
What Changes When You Apply the Filter
The filter updates all relevant widgets to show only data for the selected severity.
Affected Widgets
- Security Grade - calculated based only on the selected severity and reflects the highest risk within that scope
- Open vs Fixed Trend - shows trends only for the selected severity
- Top 10 Aging Issues - displays only issues matching the selected severity
- Remediation Velocity by Severity (SLA) - Showing only the selected severity bar
What Is Not Affected
Some widgets remain unchanged and always show full data:
- Unresolved Vulnerabilities
- Entrypoints Overview Connectivity / Coverage data
- Completed Tasks
- Scheduled Tasks
These widgets provide a general system view and are not filtered by severity.
Why Use the Severity Filter
Use the filter when you want to:
- Focus only on Critical or High risks
- Understand trends for a specific severity level
- Prioritize remediation efforts
- Reduce noise from lower-severity issues
Notes
- The filter applies to the entire dashboard
- All changes happen instantly
- The filter works together with the project selection
- Data reflects the latest available scans
Updated 3 months ago
Did this page help you?