Reviewing Scan Details
Bright allows you to monitor the scan progress, check the setup parameters and runtime notifications, as well as view the scan results. All these options are available for each scan selected on the Scans or Scans History page.
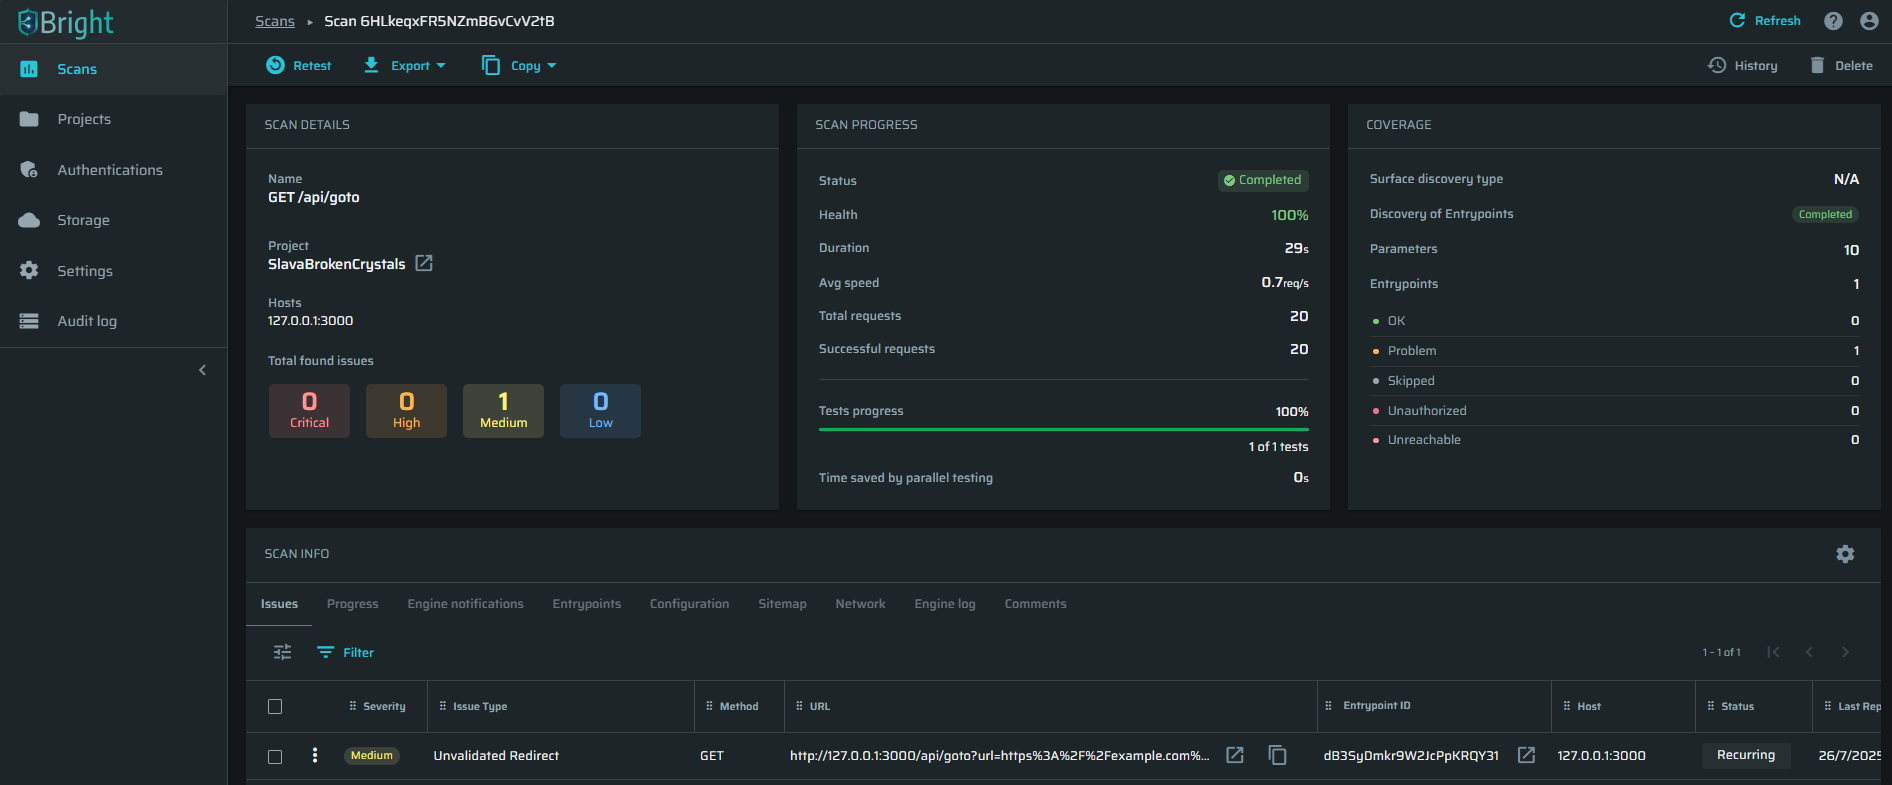
Monitoring scan progress
You can monitor scan progress in the following sections:
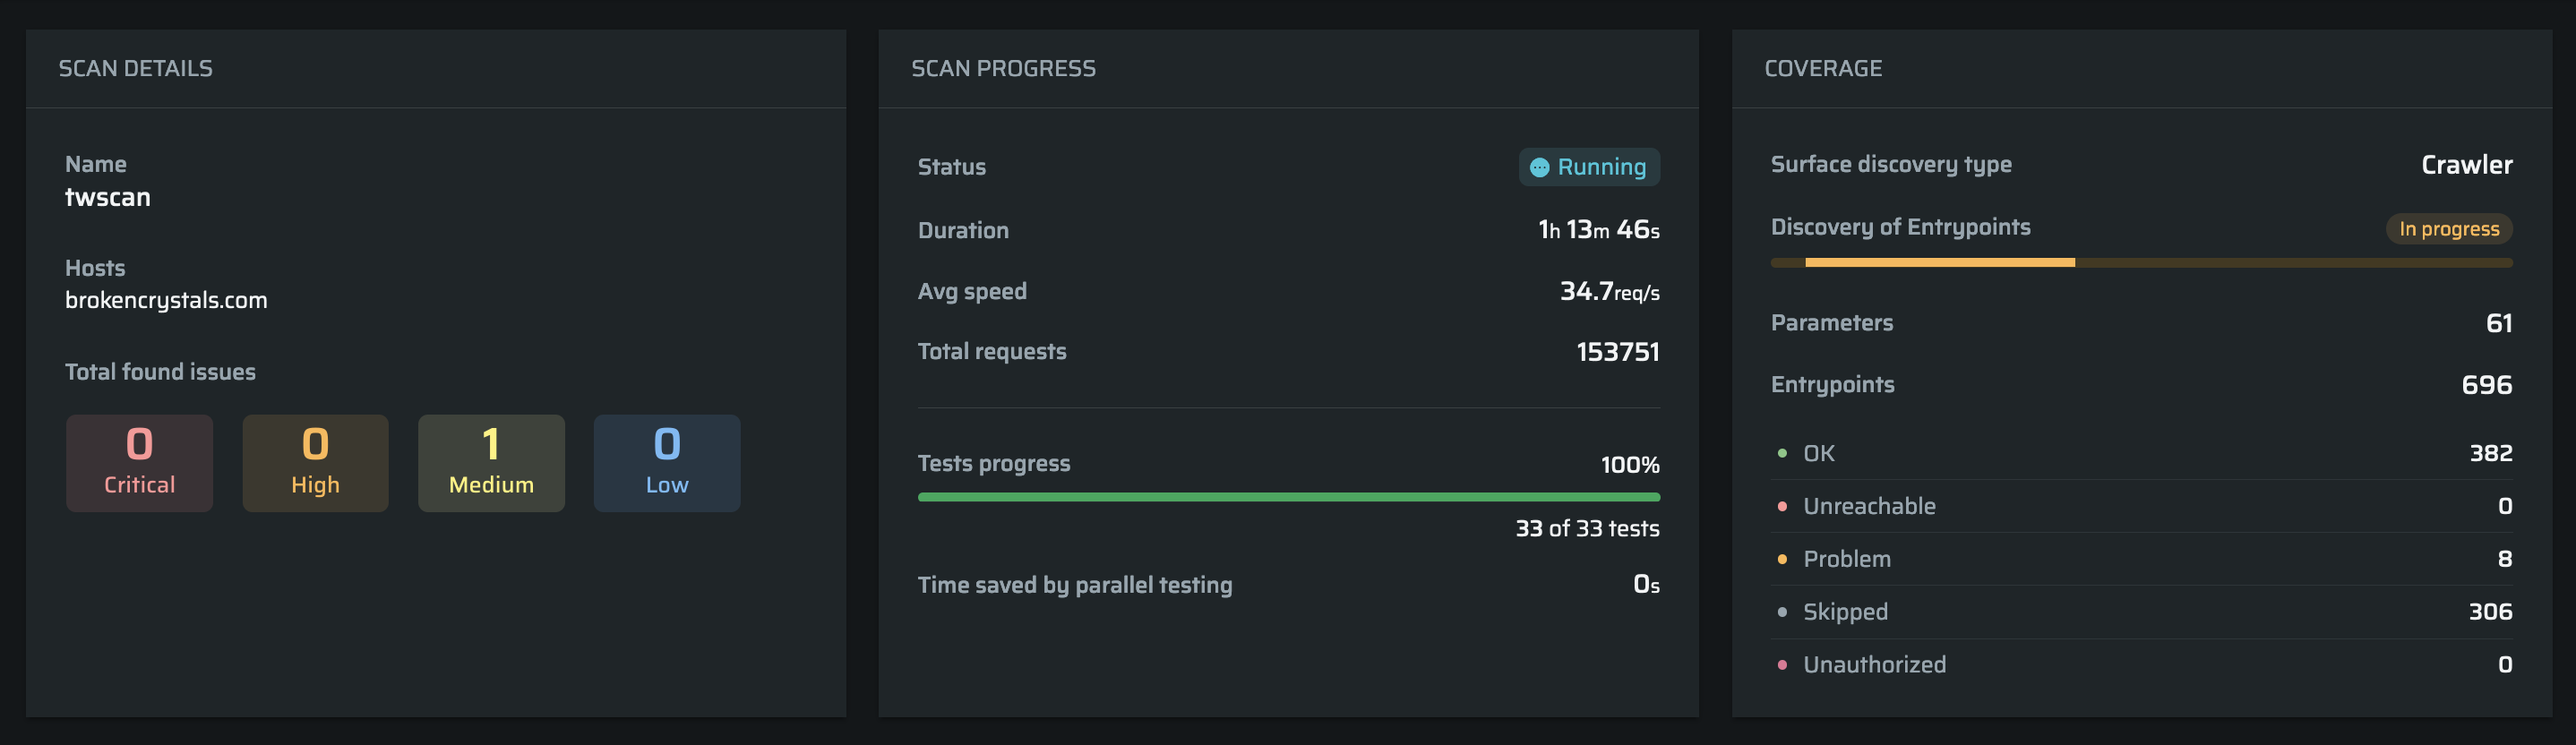
- SCAN DETAILS
Shows the basic scan info, such as the scan name, hosts, and total number of issues found divided by severity. - SCAN PROGRESS
Shows the scan status, the scan duration (till the moment, or overall if completed), average scan speed, as well as the total and successful requests. The overall progress is based on the percentage of completed tests. You can check how many tests have already been completed and how many still remain in the Progress tab of the SCAN INFO section. This module also contains the information about a time saved by a parallel testing, which usually performed during a high-concurrency tests. - COVERAGE
Shows the status of Entrypoints discovery.
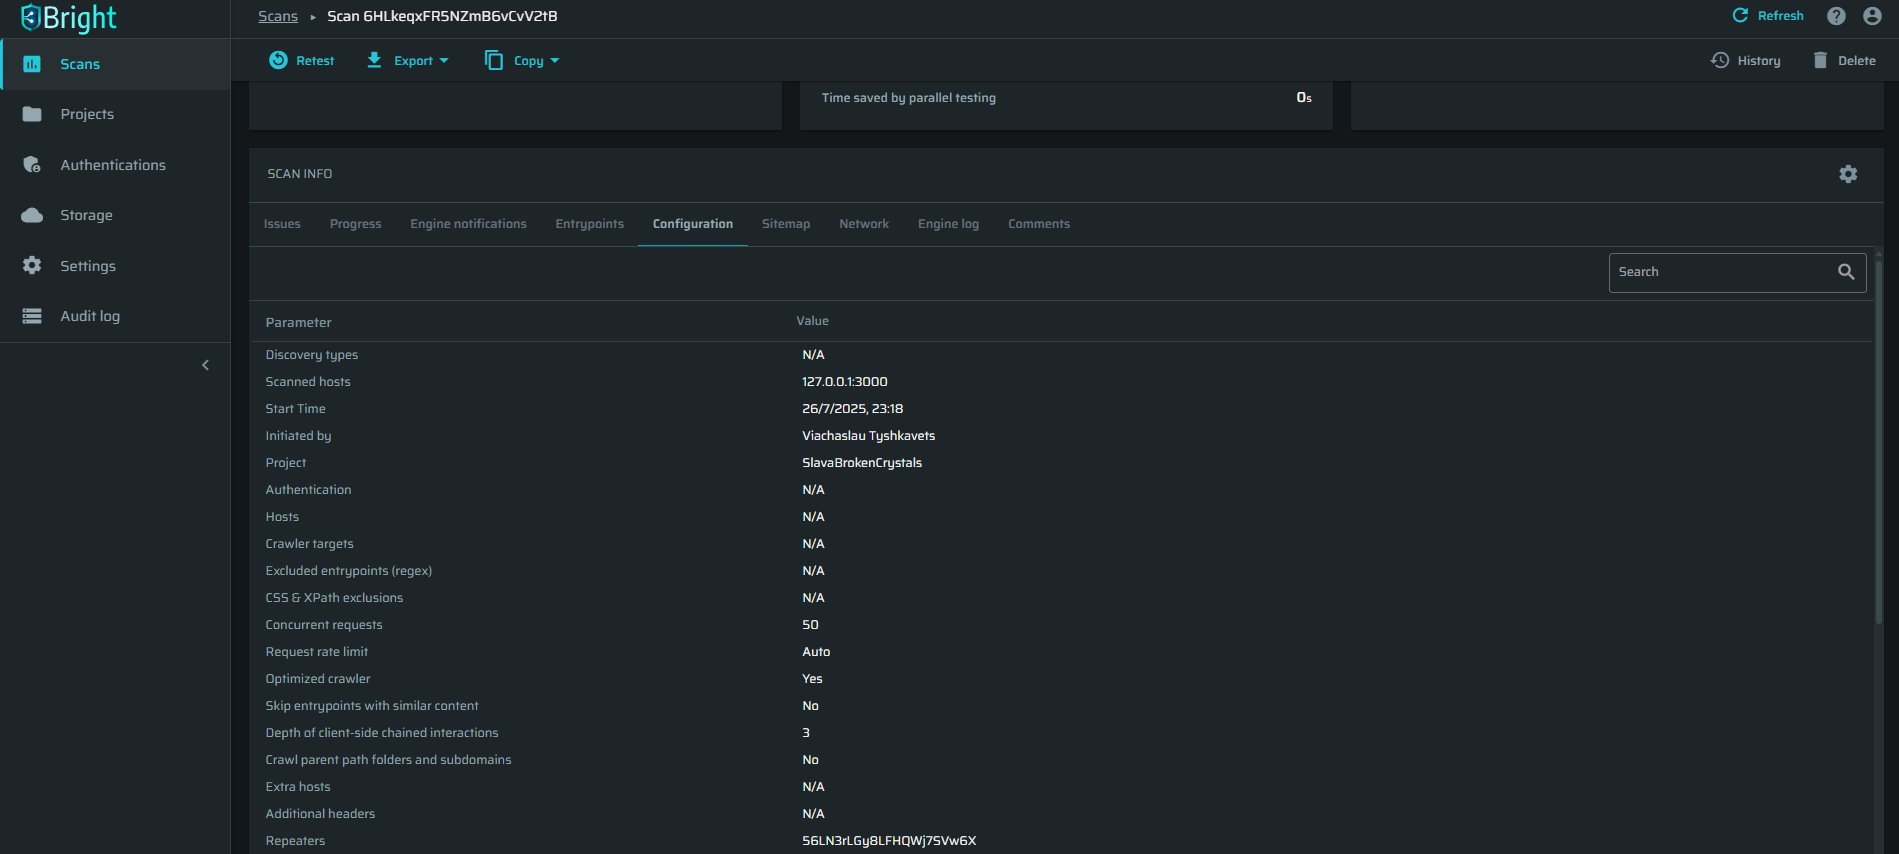
Reviewing initial scan settings
You can check the scan settings on create in the Configuration tab of the SCAN INFO section.
Reviewing scan results
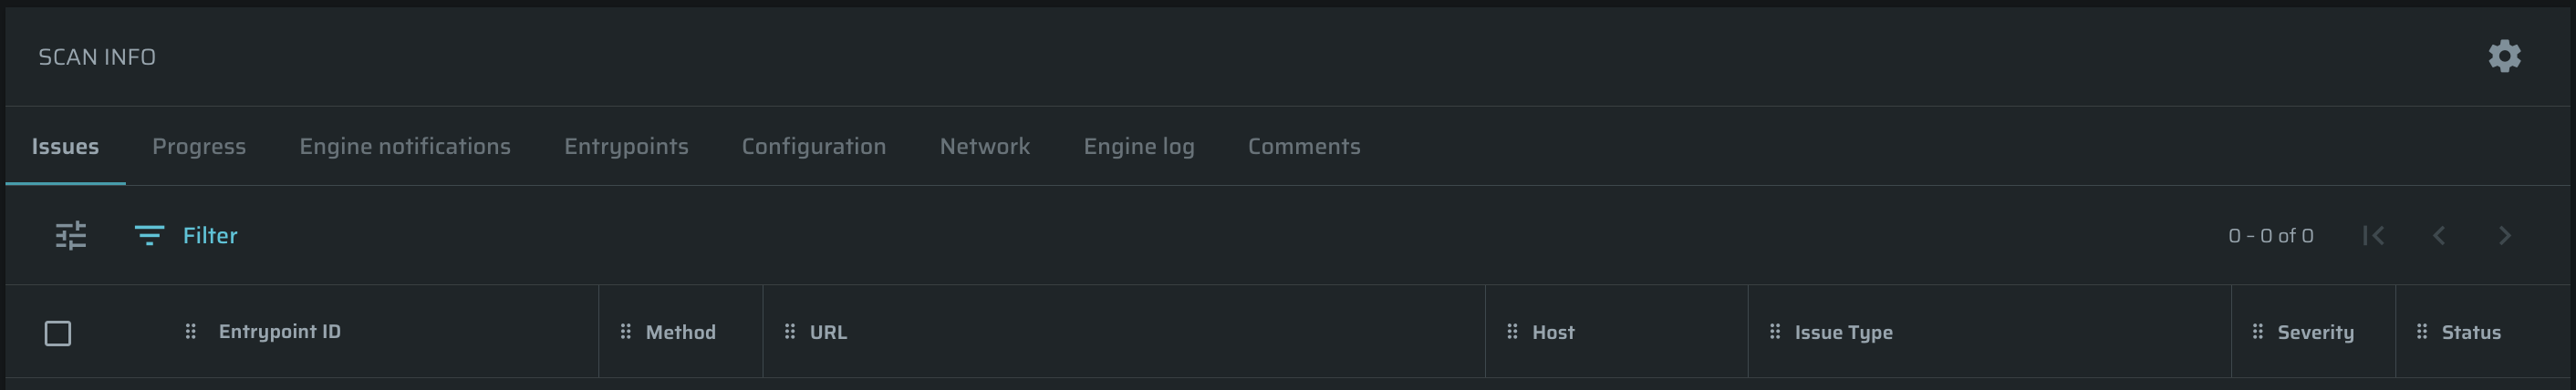
The SCAN INFO section contains detailed information related to the scan results in the following tabs:
-
Issues
Shows all the issues (vulnerabilities) detected during the scan. All the issues are grouped by issue type. You can open the report on a specific issue by clicking it from the opened issue list. Each report provides detailed information about the detected issue and the guidelines on how to fix and prevent the issue. To find more information about issue reports, see Issues Summary. -
Progress
Shows the overall progress of the scan by test, as well as detailed information about the tested entrypoints. -
Engine notifications
You can view the notifications sent by the engine during the scan and download them. -
Entrypoints
Shows all entrypoints discovered and scanned by Bright. You can open an overview for each entrypoint by selecting it from the table. The tested scenarios represent the number of compromising requests sent to the application to reveal the vulnerability. The information on the tested scenarios is provided in the engine log that you can generate in the relevant tab. To learn more about scan entrypoints, see Reviewing Entrypoints. -
Configuration
Shows all detailed parameters of the current scan that were specified during initial scan setup. -
Sitemap (disabled by default)
Shows all entrypoints discovered or scanned by Bright in a tree-form. Each Entrypoint can be expanded to show the list of parameters and their types that are associated with the entrypoint, grouped by parameters' location. -
Network
Shows the response statuses received by Bright from the application during the scan, as well as the number of responses per each status. Check this section to determine whether there may be problems with the scan. For example, if the section shows that Bright receives mostly 404 statuses, it may indicate that Bright is blocked by a WAF, or that there is an issue with authentication (it may have expired). -
Engine Log
Allows you to generate the engine logs, which are then can be downloaded via the link sent to your email.
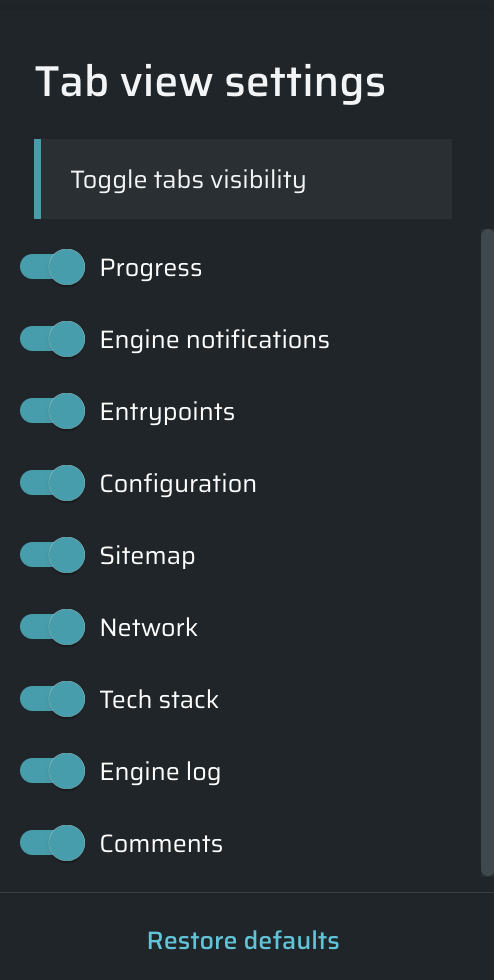
Tab adjustment
Bright provides the ability to customize the visible tabs on the Scan details page. To open the page settings, click ![]() on the right side of the Scan tab. Now you can toggle tabs visibility, or restore defaults.
on the right side of the Scan tab. Now you can toggle tabs visibility, or restore defaults.
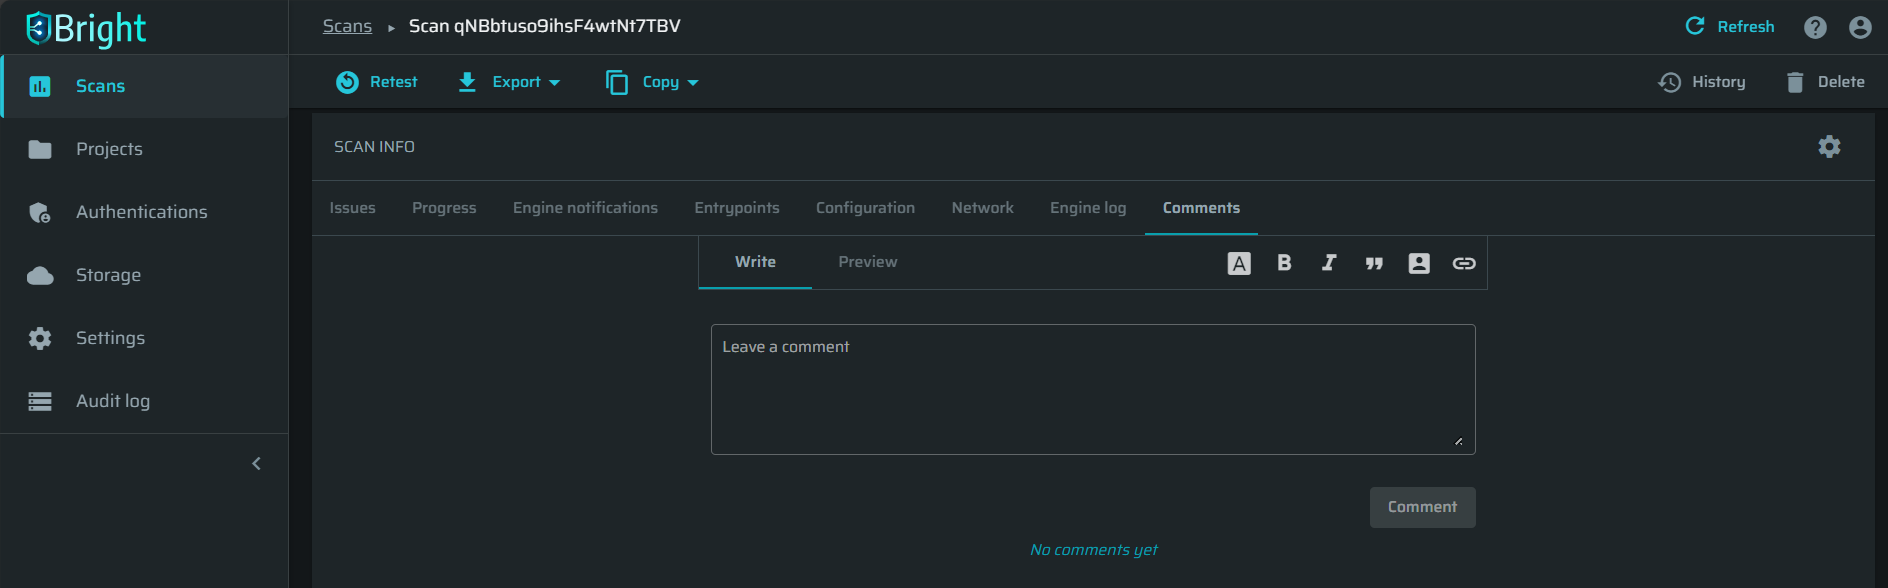
Adding comments to a scan
The Comments tab enables you to add comments and notes describing the scan, notes for yourself, or notes for other members of your organization. You can format the comment using Markdown or the provided formatting tools. To mention other users in your organization, use the @ symbol.
After the comment is ready, click Preview to check the final view of the comment or Comment to post the comment immediately. After the comment has been posted, a new section called TOTAL COMMENTS appears at the bottom of the page. This section shows all comments posted previously. To include a comment in the scan report, select the Include in report checkbox under the comment.
Updated 12 months ago