Reviewing Entrypoints
An Entrypoint is a unique request/response pair that will include the request/response structure, parameters, authentication, etc.
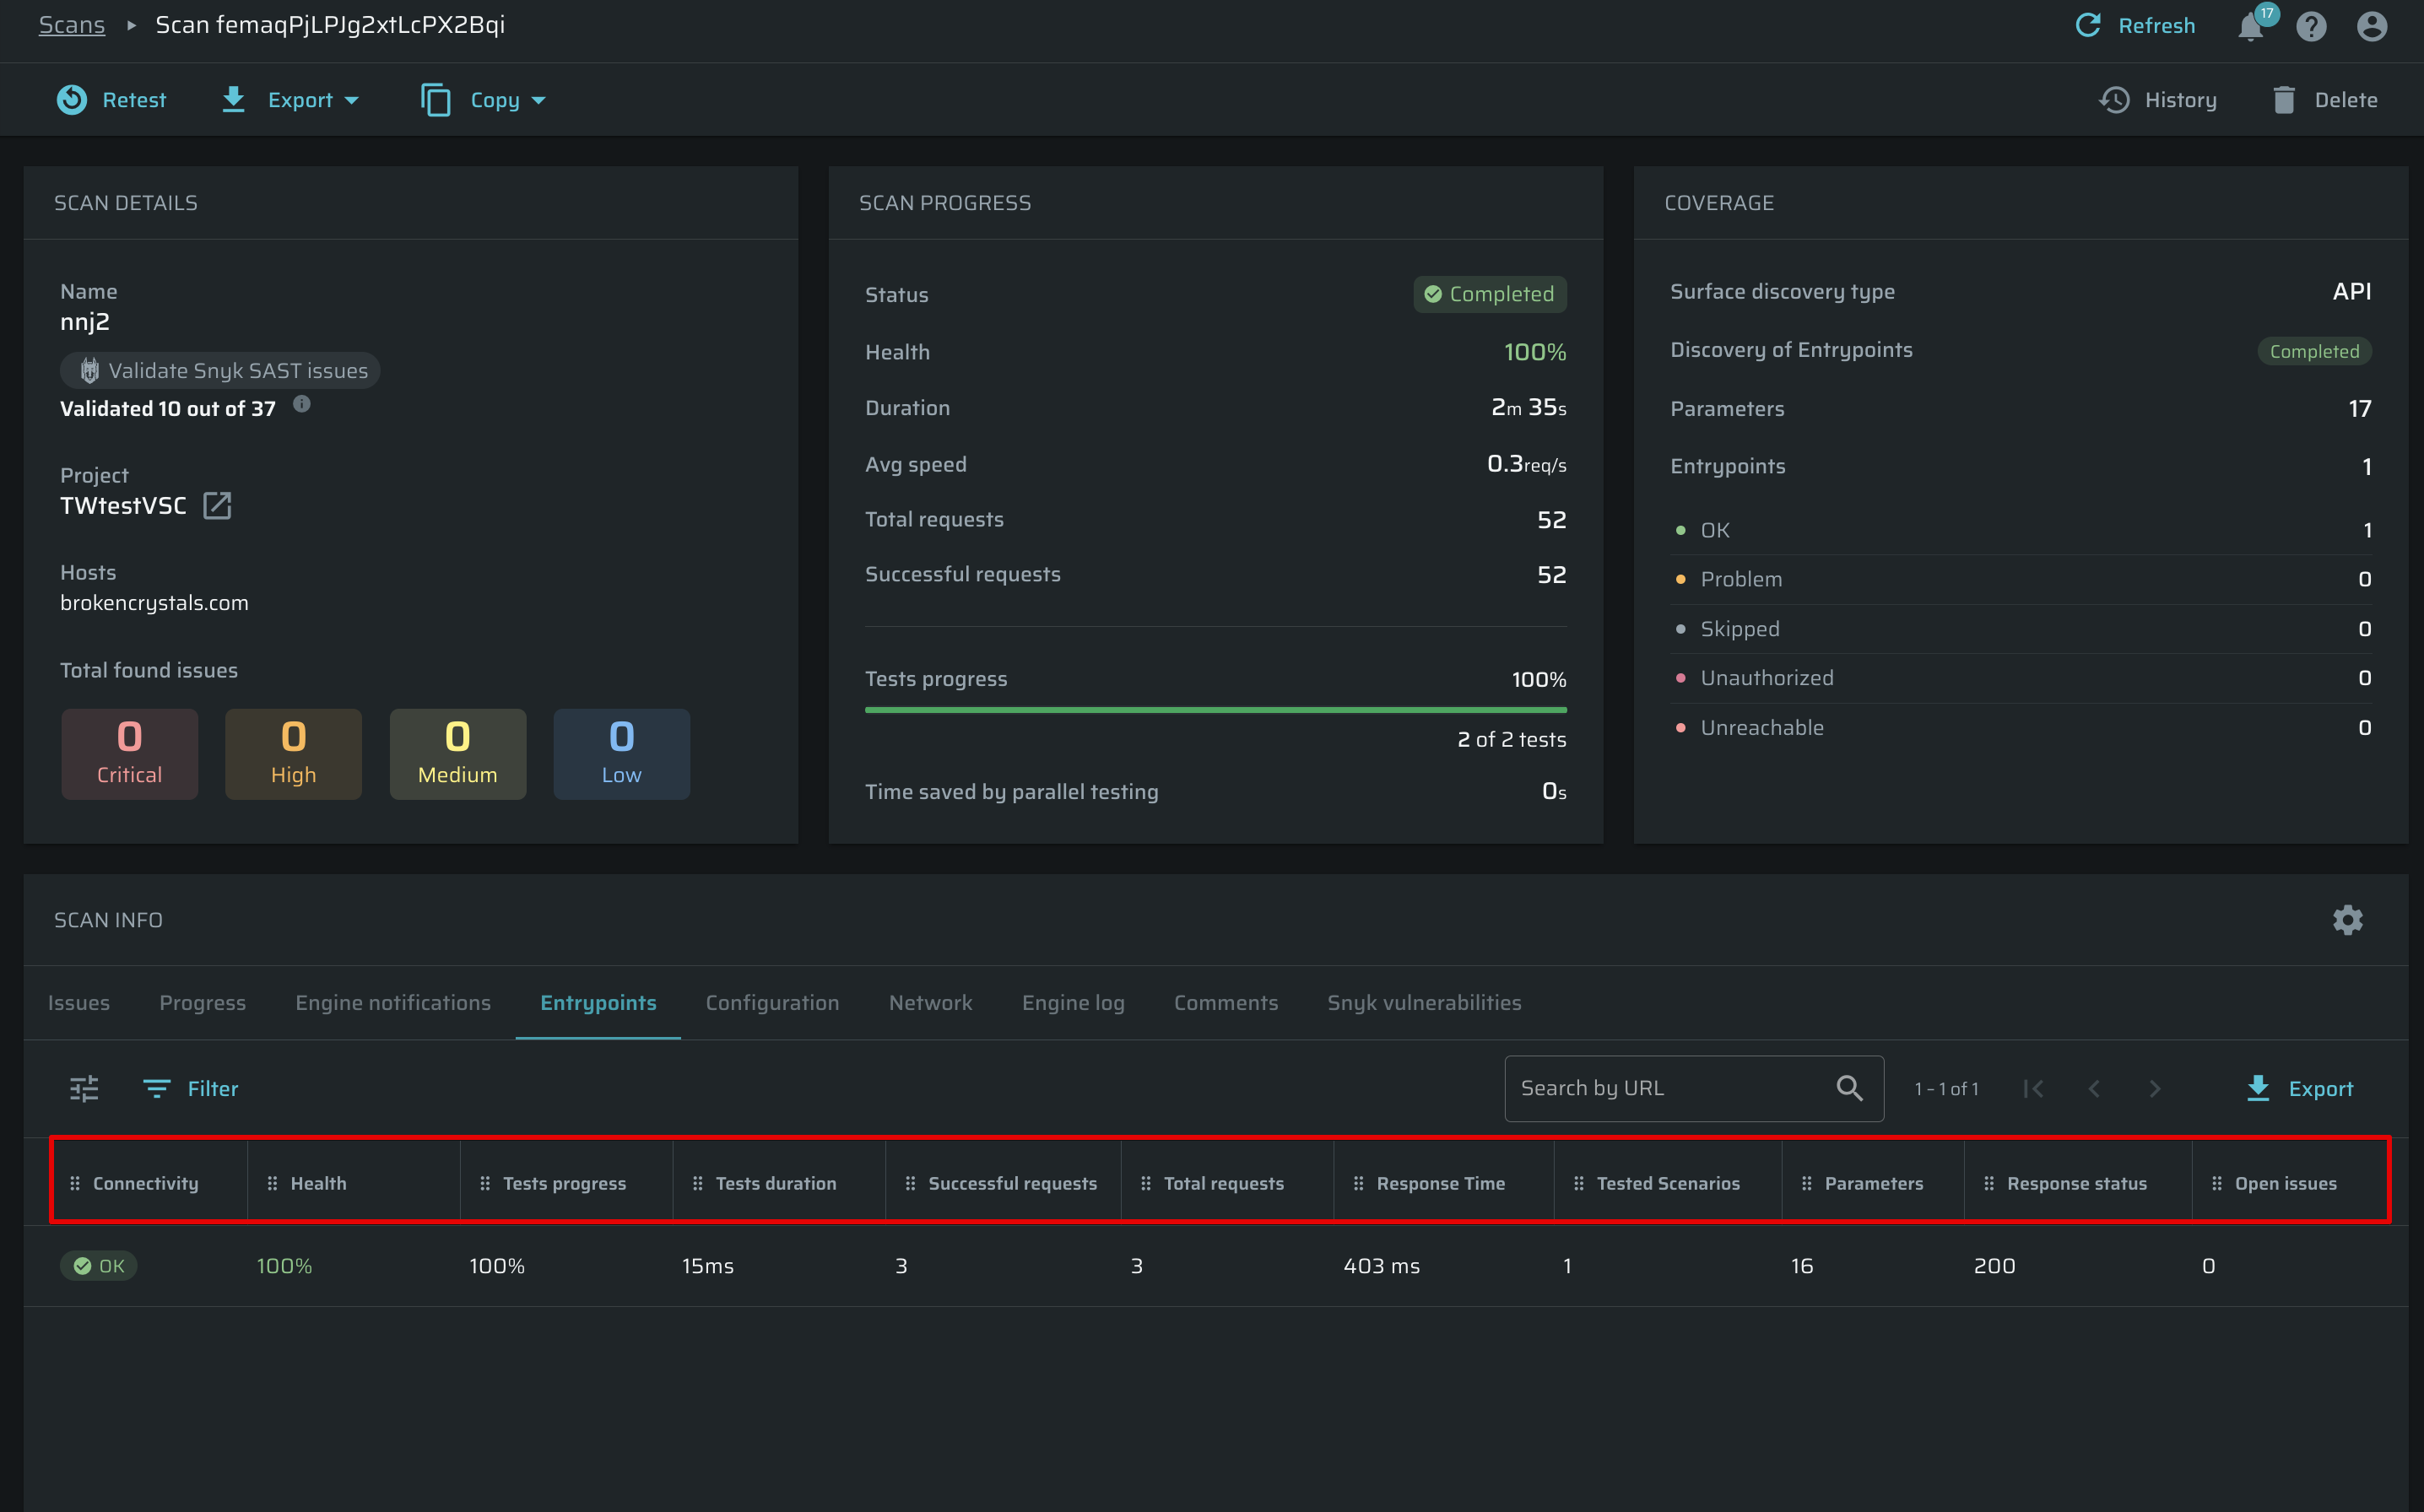
The Entrypoints table includes the following columns:
- Connectivity - status of an Entrypoint
OK- an Entrypoint reached successfully and returned a valid responseUnreachable- an Entrypoint could not be reachedProblem- an Entrypoint is reachable but returned with problematic response statusUnauthorized- an Entrypoint is reachable but has failed the authenticationSkipped- an Entrypoint was skipped in the current scan scope
- Health - indicates an entrypoint's performance and reliability, calculated by dividing the number of successful requests by the total number of requests. A successful request is a request which doesn't match any of the following:
- TCP errors.
- Network timeouts and gateway errors - HTTP response status codes: 502, 503, 504.
- Rate-limiting - HTTP response status code: 429.
- Authentication errors - when accessing an entrypoint using an authentication object fails (results in the re-auth triggers).
- Test Progress
- Test duration
- Successful Requests
- Total Requests
- Response time
- Tested scenarios - the number of attack scenarios that were done in the particular entrypoint for all related tests
- Parameters
- Response Status
- Open Issues
Connectivity statuses are available for new scans only, the old ones will have anN/Astatus. Retest a scan to make all Entrypoints have connectivity statuses.
Filtering scans
To simplify searching for a particular scan, Bright allows you to filter Entrypoints by multiple parameters, such as:
- Entrypoint ID
- Response time
- Connectivity
To apply a filter, follow these steps:
-
In the header of the Entrypoints table, click Filter.
-
In the Filter by dialog box, select the necessary filter option and set up the relevant filter parameters.
-
(Optional). If you need to apply several filters at once, click + Add filter to apply one more filter.
-
Click Apply.
To reset the filter parameter(s), follow these steps:
-
At the top of the ENTRYPOINTS table, click the applied filter parameter(s).
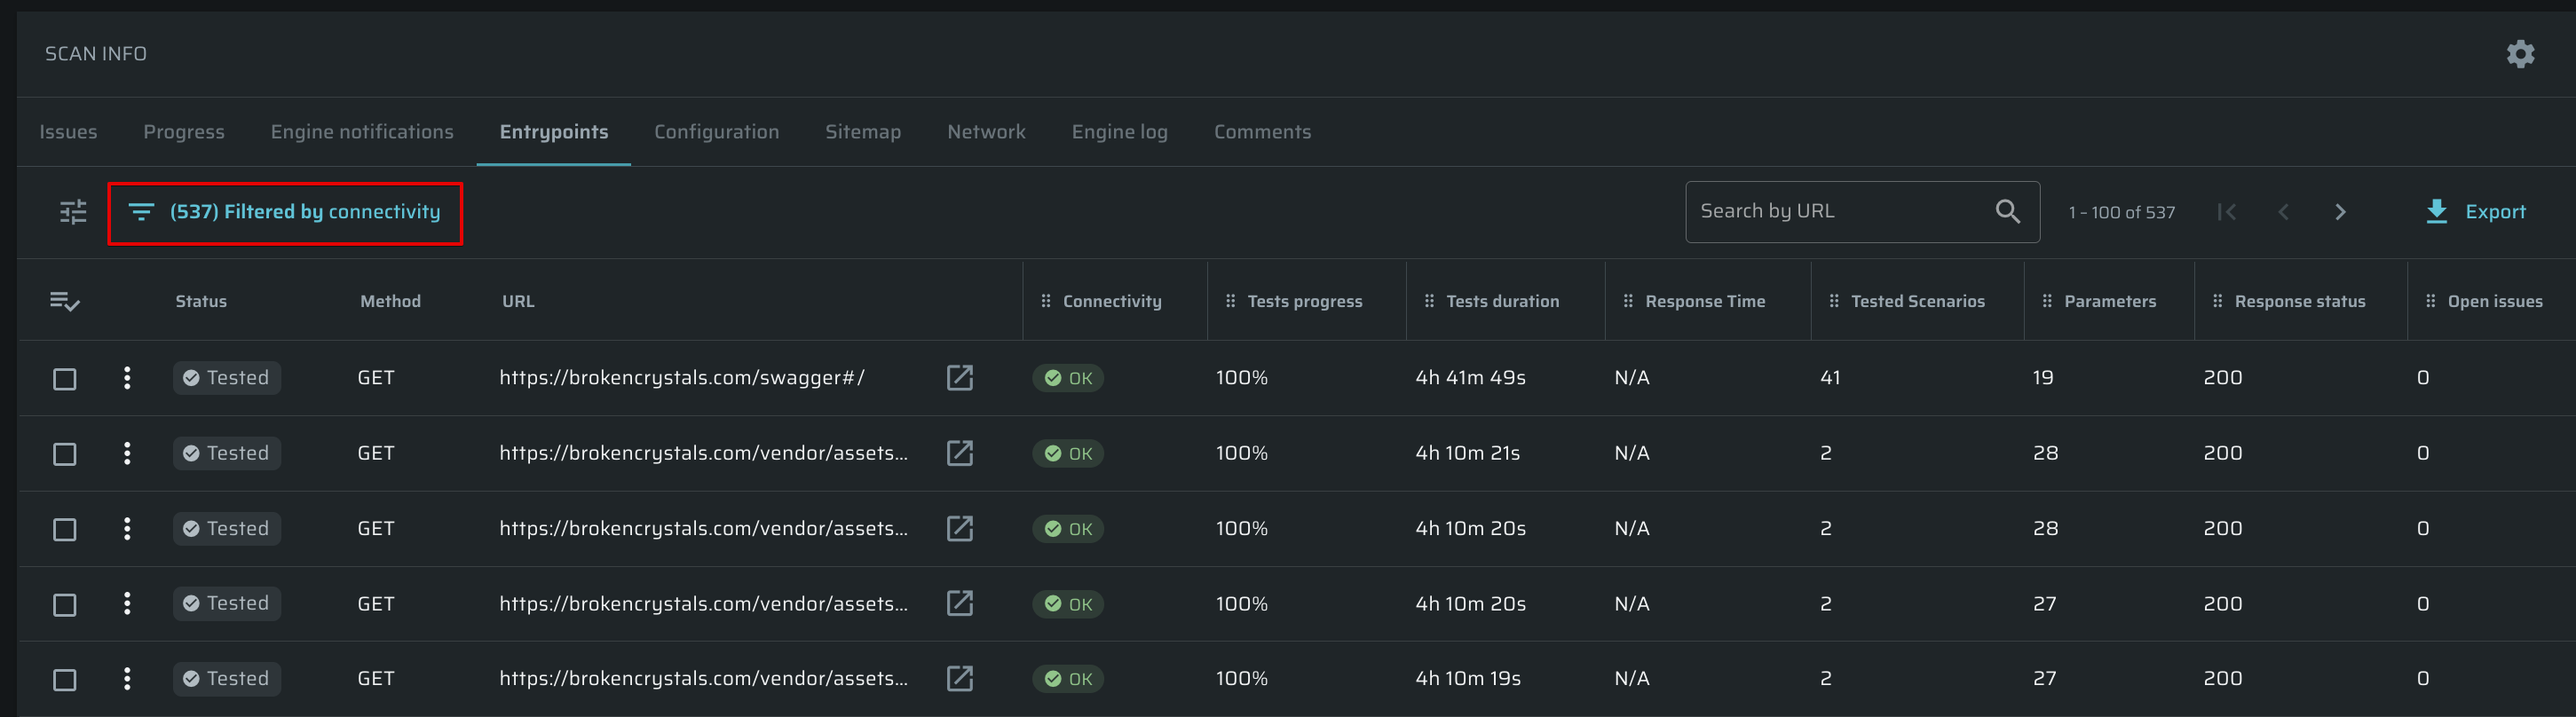
-
In the Filter by dialog box, click Clear all and then Apply.
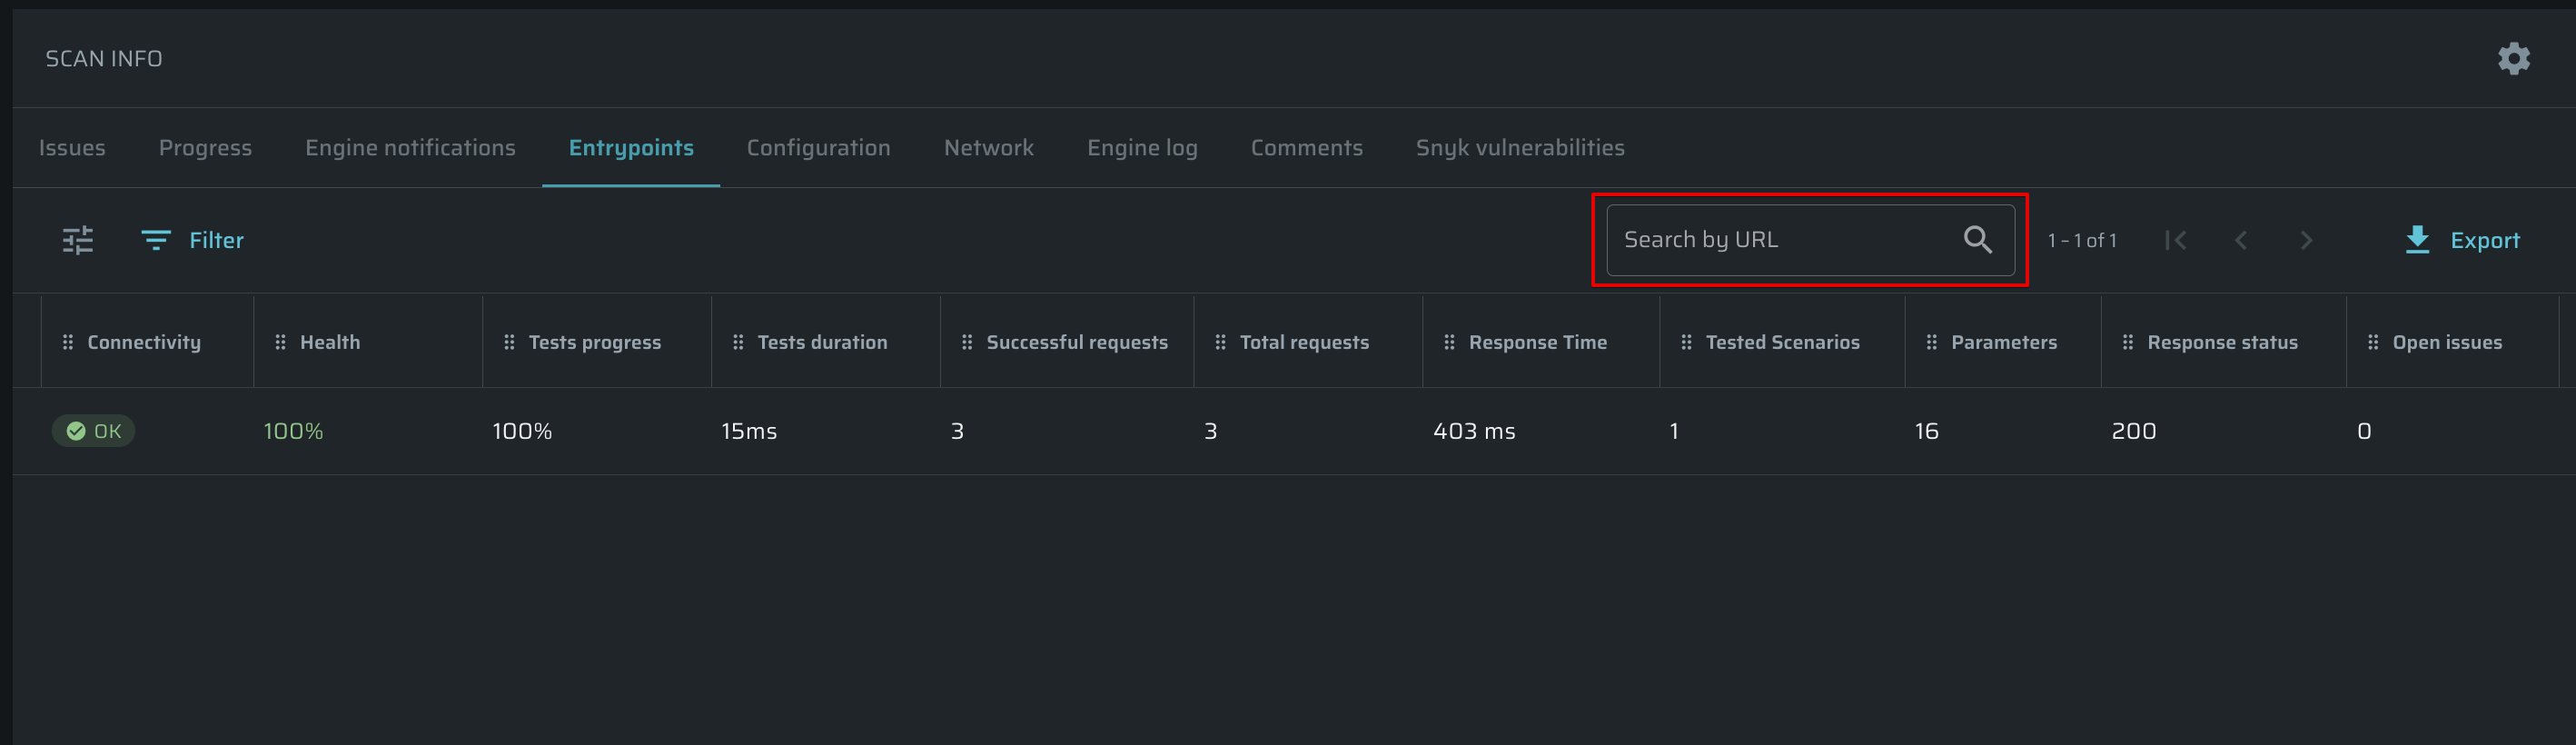
You can also search for a particular Entrypoint by its URL (even using a partial URL) across the table using the Search bar.
Sorting Entrypoints
Entrypoints can be sorted by column parameters, either in ascending or descending order. For example, you may need to filter the entrypoints by their connectivity or put the entrypoints with a fast response first.
To do that, click on the arrow next to the parameter in the header of the scans. Click on the arrow again to change the item order between ascending and descending
Adjusting the Entrypoints table
Bright allows you to change the visibility of columns, adjust their width, and choose the number of items per page using the Table Settings menu. Also, you can change the order of the columns simply by drag-and-drop action.
To configure the Entrypoints table view, follow these steps:
-
Click
 to open the table settings.
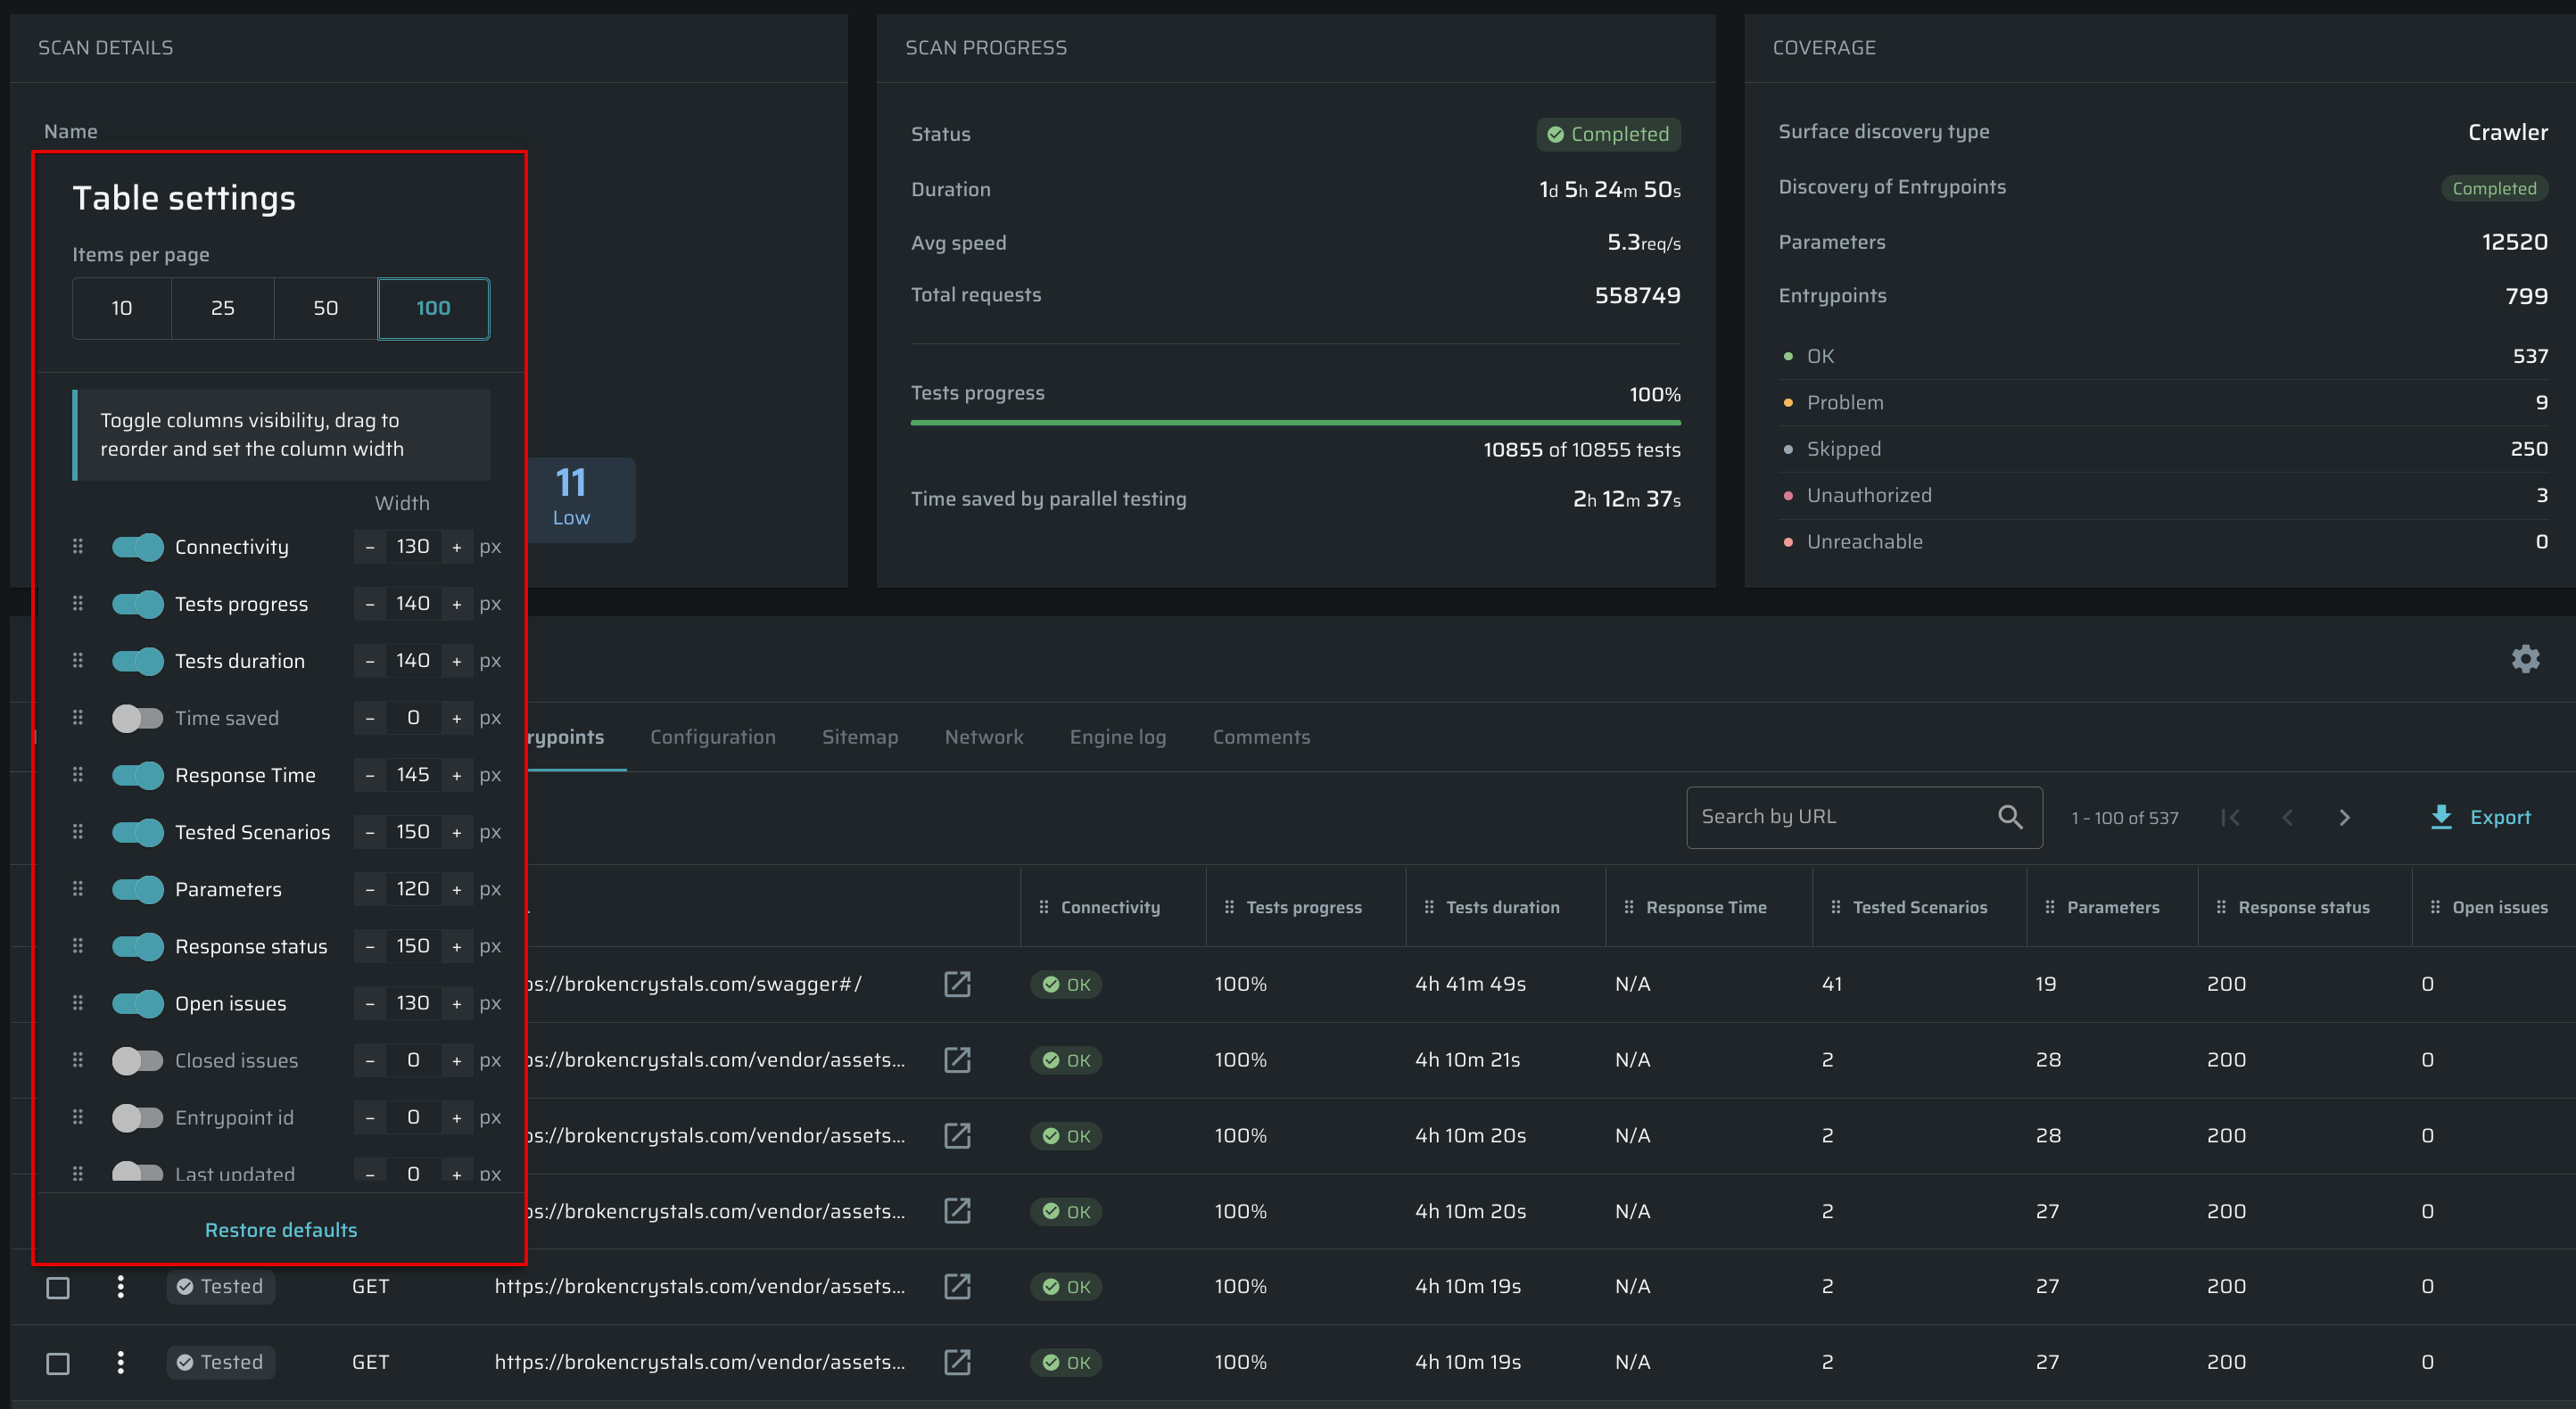
-
(Optional). To reset the table settings to default, click Restore defaults at the bottom of the dialog box.
Copying the Entrypoint data
Bright allows users to copy the entrypoint data and then reuse it quickly. By clicking ![]() next to the entrypoint, you can access the quick actions menu and then copy the entrypoint URL or copy the request as cURL.
next to the entrypoint, you can access the quick actions menu and then copy the entrypoint URL or copy the request as cURL.
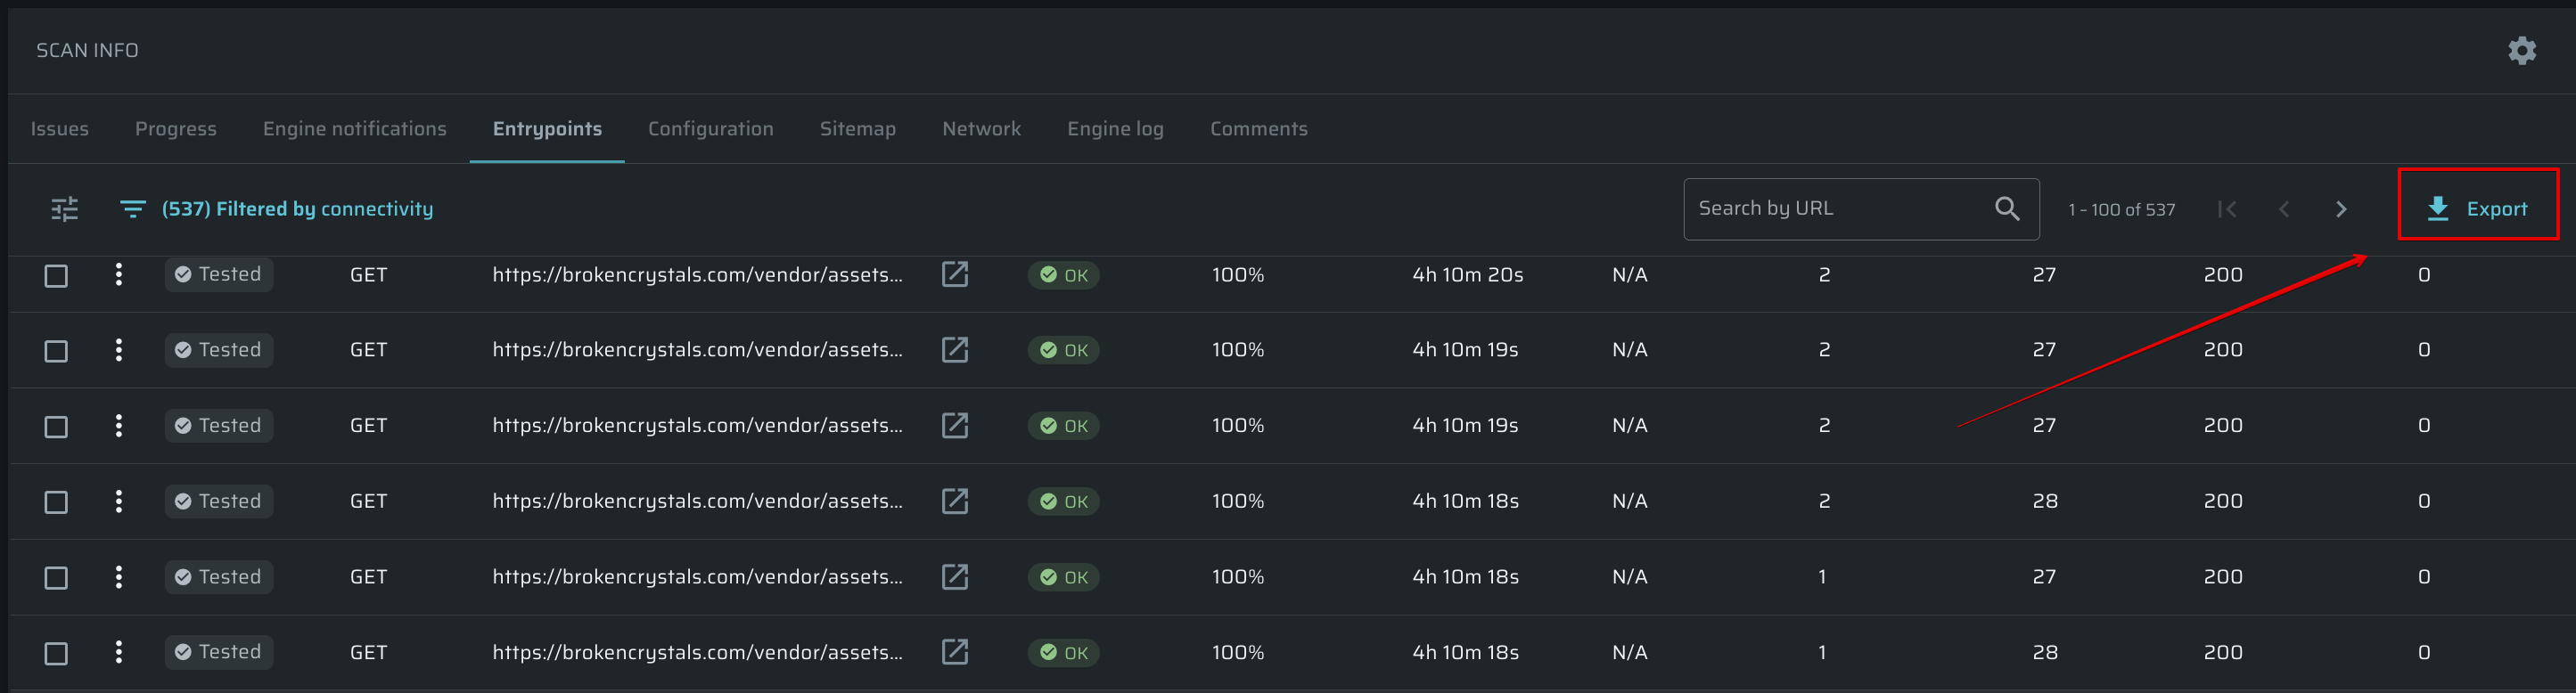
Exporting Entrypoints
Bright allows users to export all the scan Entrypoints as a .CSV table. To export Entrypoints, click Export at the top of the table.
Reviewing Entrypoints summary
This page contains all the information about the particular entrypoint. To open it, click on the entrypoint in the Entrypoints table.
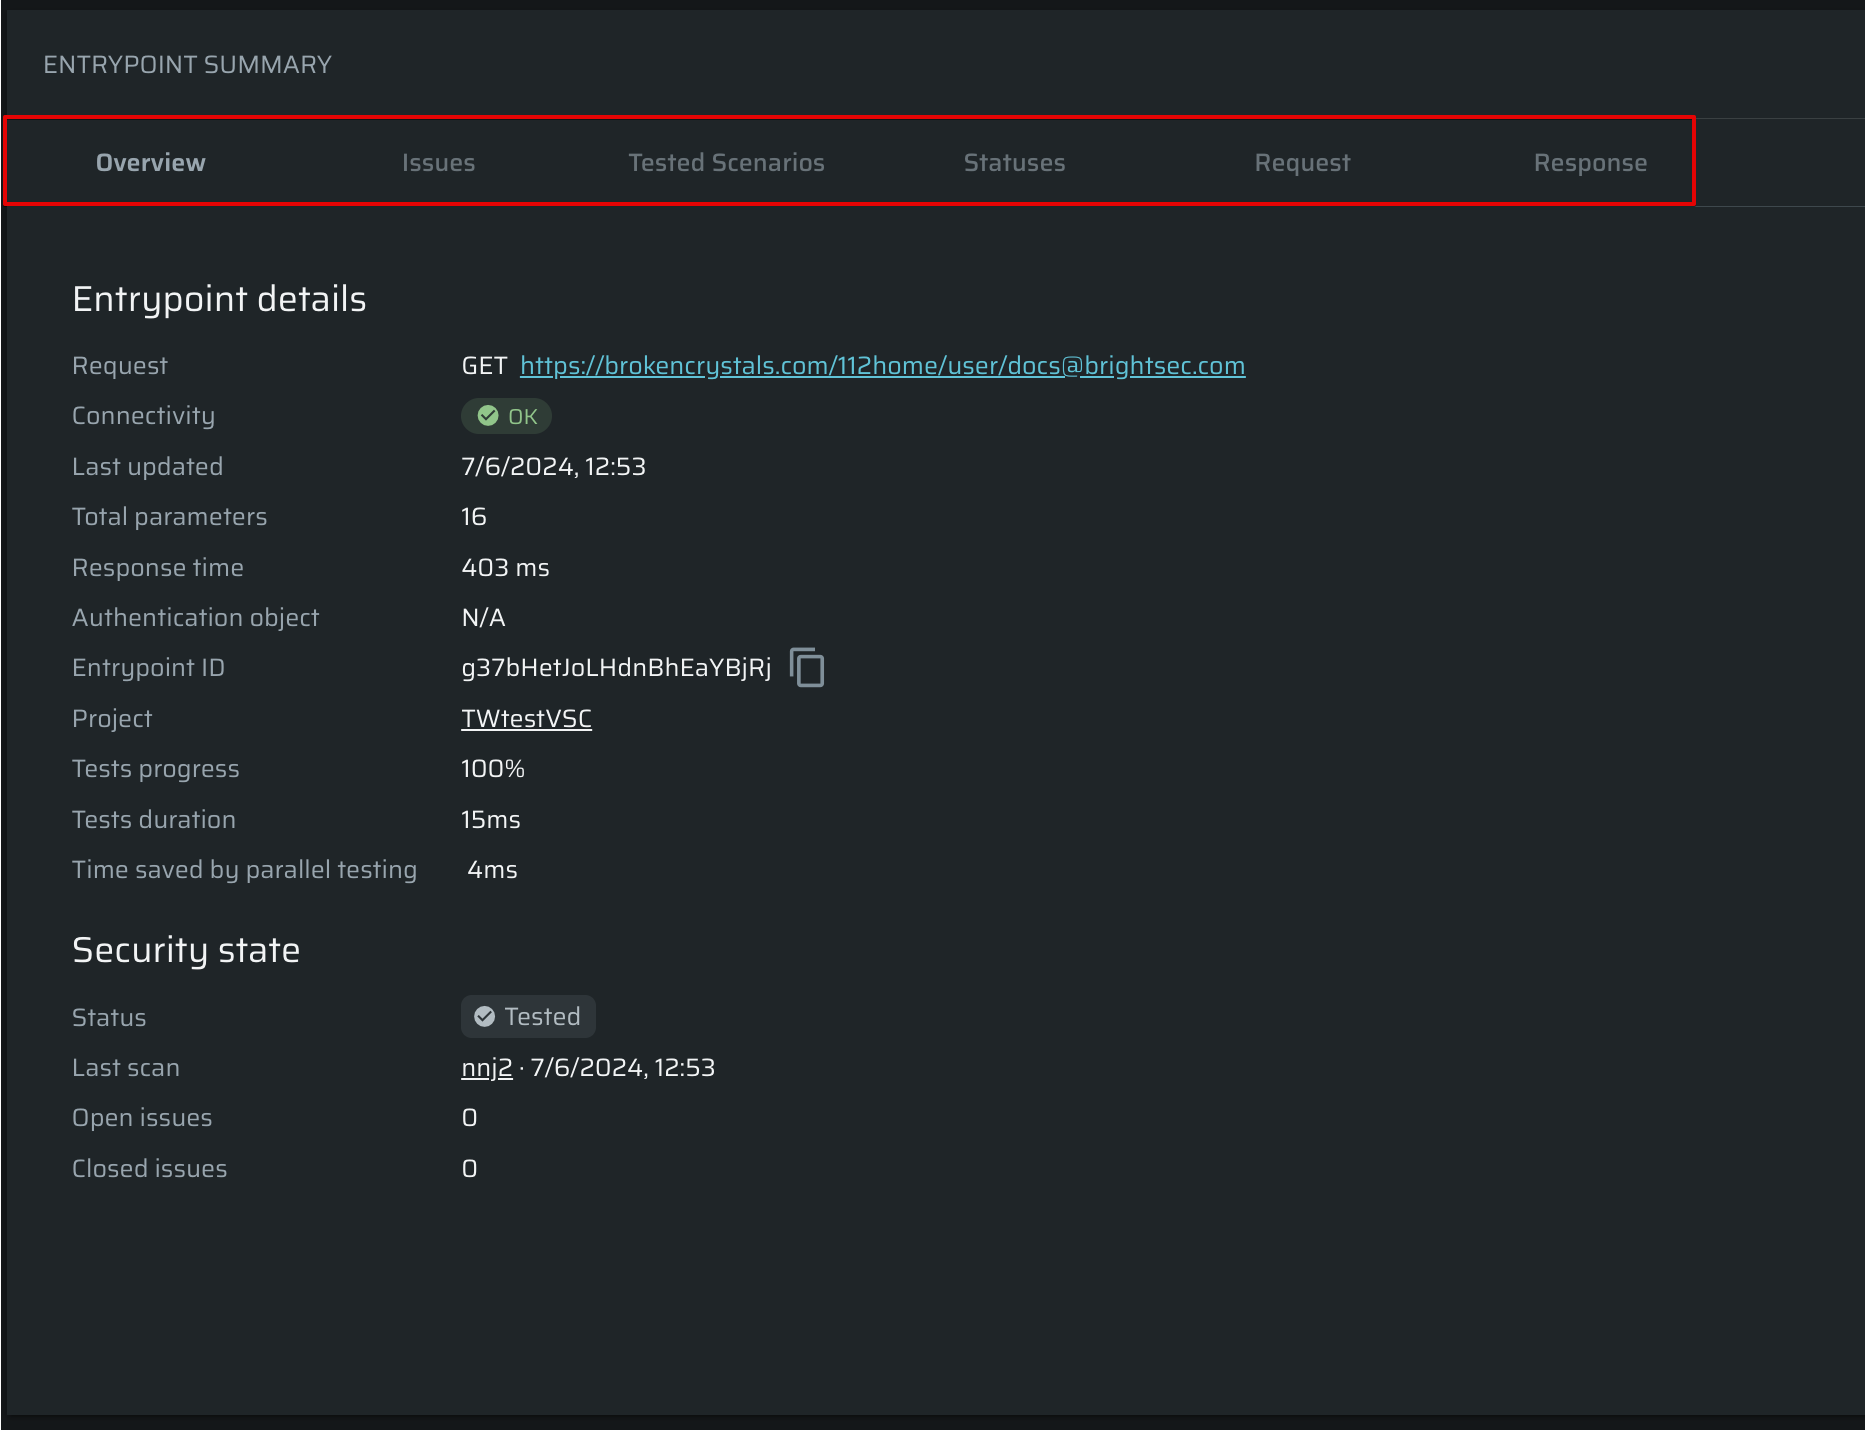
The Entrypoint details page consists of the following tabs:
-
Overview - detailed information about the entrypoint
- Request - method and entrypoint URL
- Connectivity - status of the Entrypoint
- Total parameters - discovered parameters available for attack
- Response time -
- Entrypoint ID -
- Tests progress - percentage of completed tests performed
- Tests duration
- Time saved by parallel testing - indicates how much time would have been spent if tests were conducted one by one instead of simultaneously
-
Issues - This tab contains a table with key information about issues related to this entrypoint. By clicking the
 you can manage each issue: resolve, reopen or ignore it.
For better visibility, there is a Found in current scan column, which indicates if the issue was found in this particular scan.
By clicking any issue type name, it's possible to move to another issue to analyze it.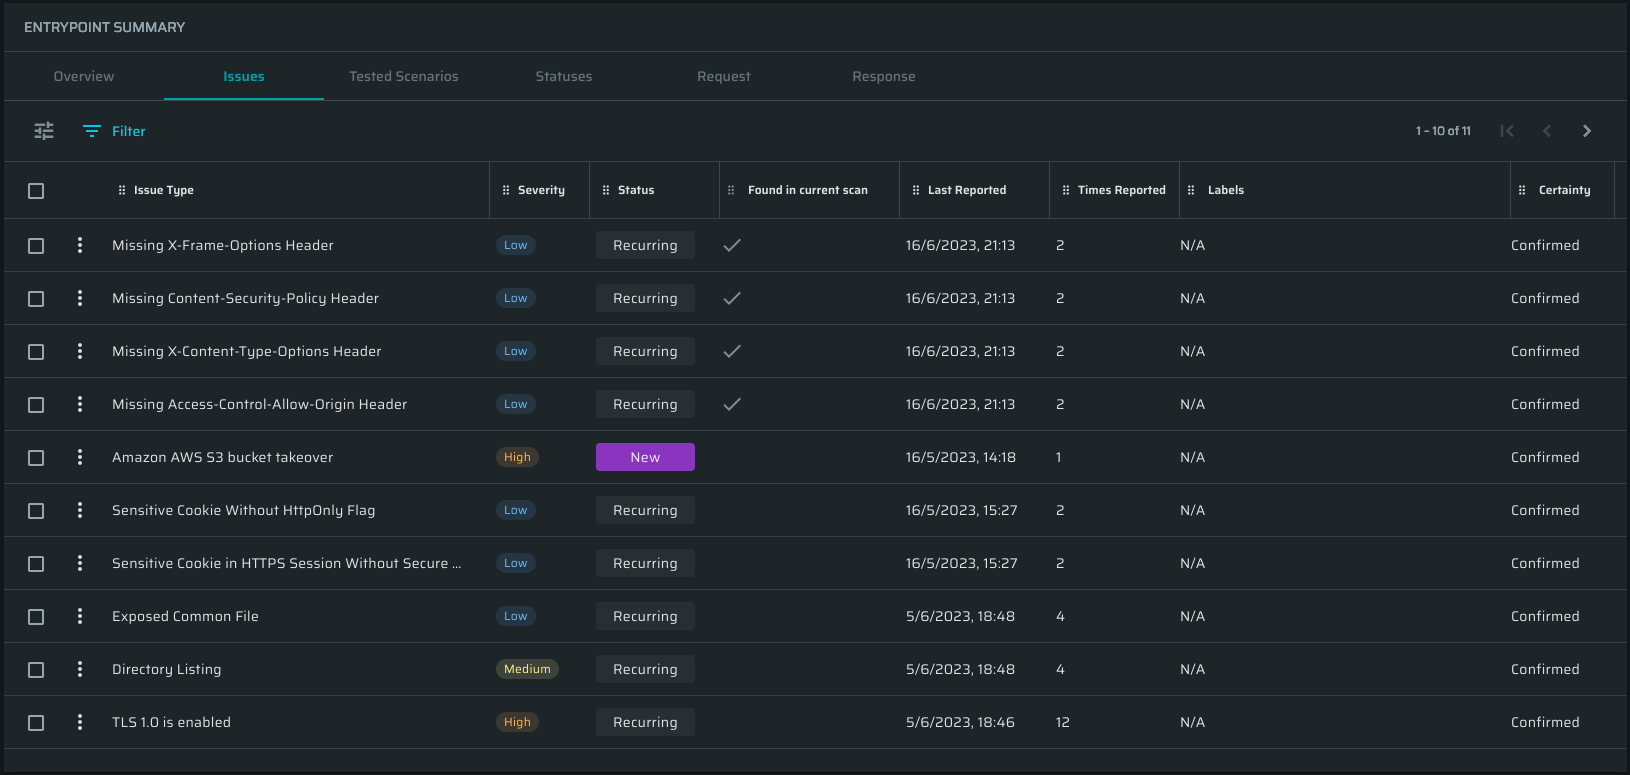
-
Tested Scenarios - contains a table with a list of executed tests with several scenarios, found issues, severity, and notes. Scenarios represent the number of compromising requests sent to the application to reveal the vulnerability.
-
Statuses - contains the table with all collected Connectivity statuses
-
Request - contains the entrypoint method, the URL, and the headers.
-
Response - contains the entrypoint status, its headers, and the body.
Updated about 2 months ago