Project Dashboard
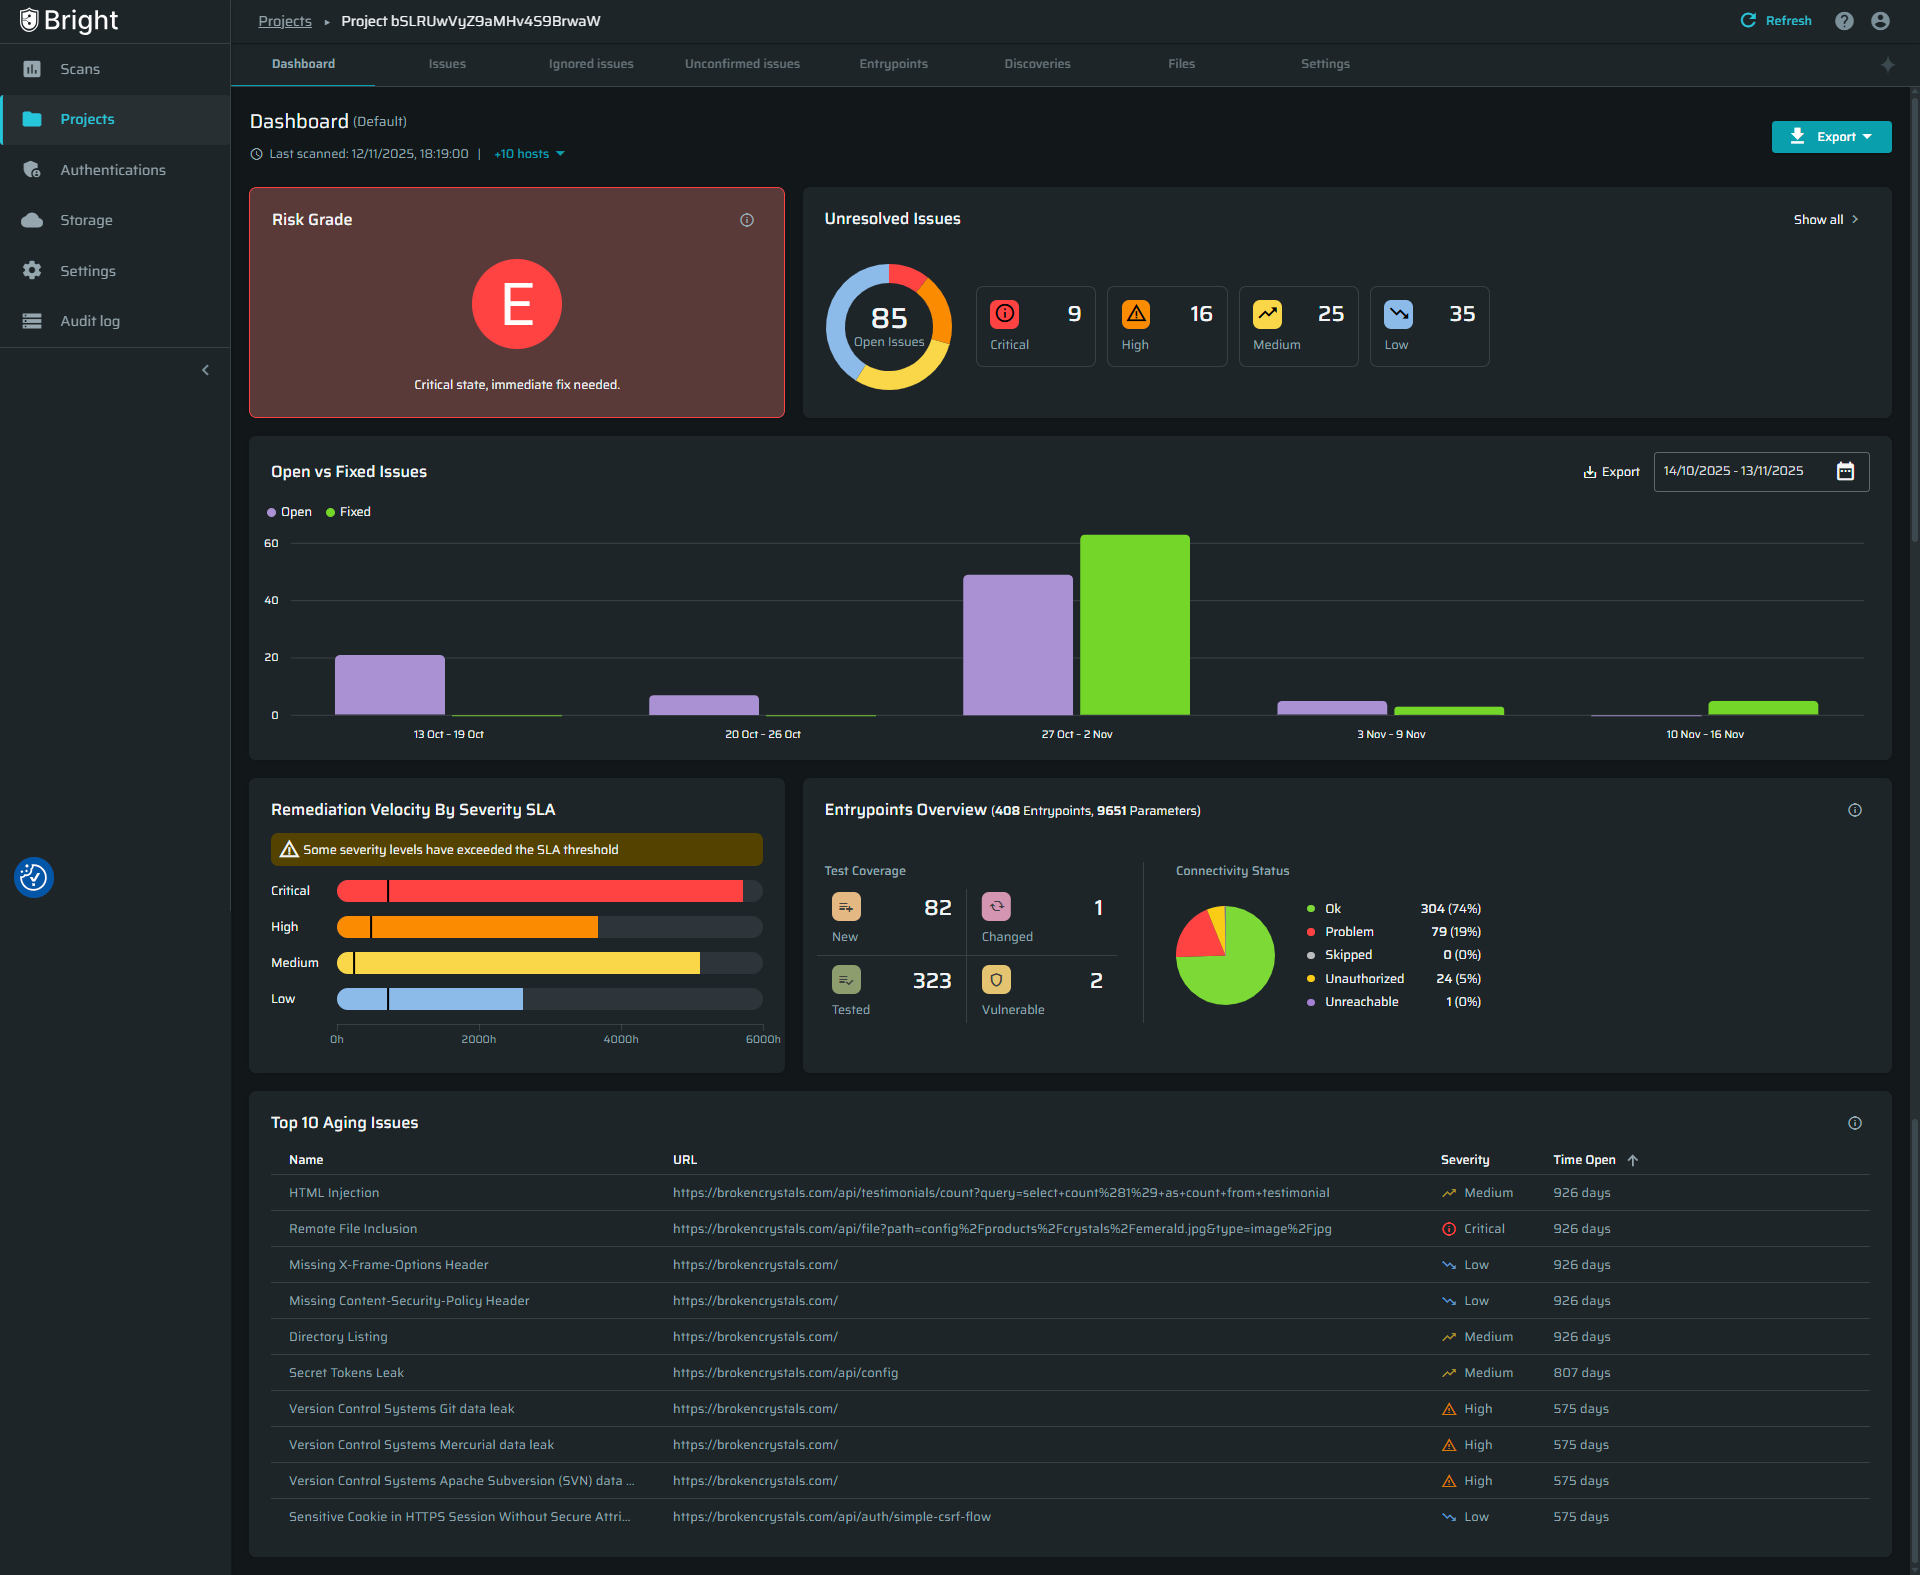
The Project Dashboard provides an overview of each project’s security posture.
The Project Dashboard provides an overview of each project’s security posture.
It aggregates scan data into key performance indicators (KPIs) such as posture grade, open vs fixed issues, MTTR vs SLA, and security debt.
The dashboard updates automatically after every completed scan and allows exporting individual widgets or full summaries for reporting purposes.
Accessing the Dashboard
- Go to the Projects page.
- Click on the desired project.
- The Dashboard tab opens automatically as the default view.
Navigation Path:
Projects → [Project Name] → Dashboard
Permissions and Access
- All users with project access can view the dashboard.
- Editing SLA settings requires
project.sla:managepermission. - Exporting data (CSV/PDF) requires
project.reports:read.
Data Refresh and Update Behavior
Dashboard data updates automatically following every completed scan.
If no new scan data is available, widgets will display the latest available snapshot.
Dashboard Widgets
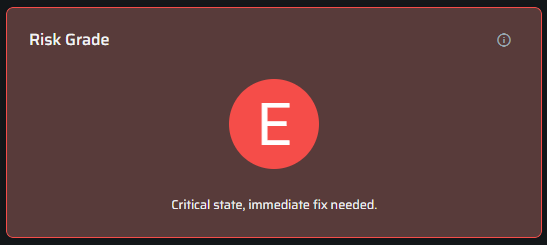
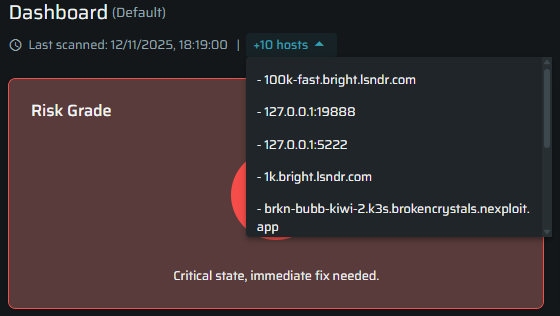
1. Risk Grade (A-E)
The Risk Grade provides an instant, intuitive snapshot of the project’s overall security posture.
It is automatically calculated based on the number and severity of unresolved vulnerabilities (CVSS) detected across the project.
- A - Excellent
Indicates minimal security risk. The project contains very few or no open vulnerabilities. Any issues that were detected are low-severity and were remediated quickly. Reflects a strong, proactive security posture. - B - Good
Represents a generally healthy security status. Some medium-severity vulnerabilities may still be open, but the overall risk exposure remains controlled. - C - Moderate
Shows the presence of noticeable vulnerabilities across multiple components. Typically includes a mix of medium and high severity issues. Requires focused remediation to prevent escalation. - D - Poor
Indicates outstanding high-severity vulnerabilities and delayed or limited remediation activities. The project’s security posture is weakened and needs immediate attention. - E - Critical
Reflects severe, widespread vulnerabilities and significant security debt. Exposure is high and requires urgent remediation to restore acceptable security levels.
Grades are dynamically updated based on scan results and vulnerability resolutions.
Closed issues (resolved vulnerabilities) improve the grade, while new or reopened issues lower it. The calculation considers volume, severity, and recency of vulnerabilities.
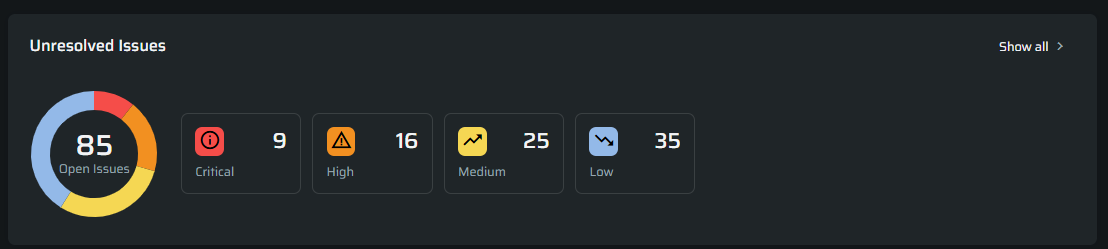
2. Unresolved Vulnerabilities
Displays a color-coded breakdown of open vulnerabilities by severity level.
Actions & Interactions:
- Click any severity box or “Show All” to open a detailed drawer view.
- Hover over the donut chart to see percentage breakdowns by severity.
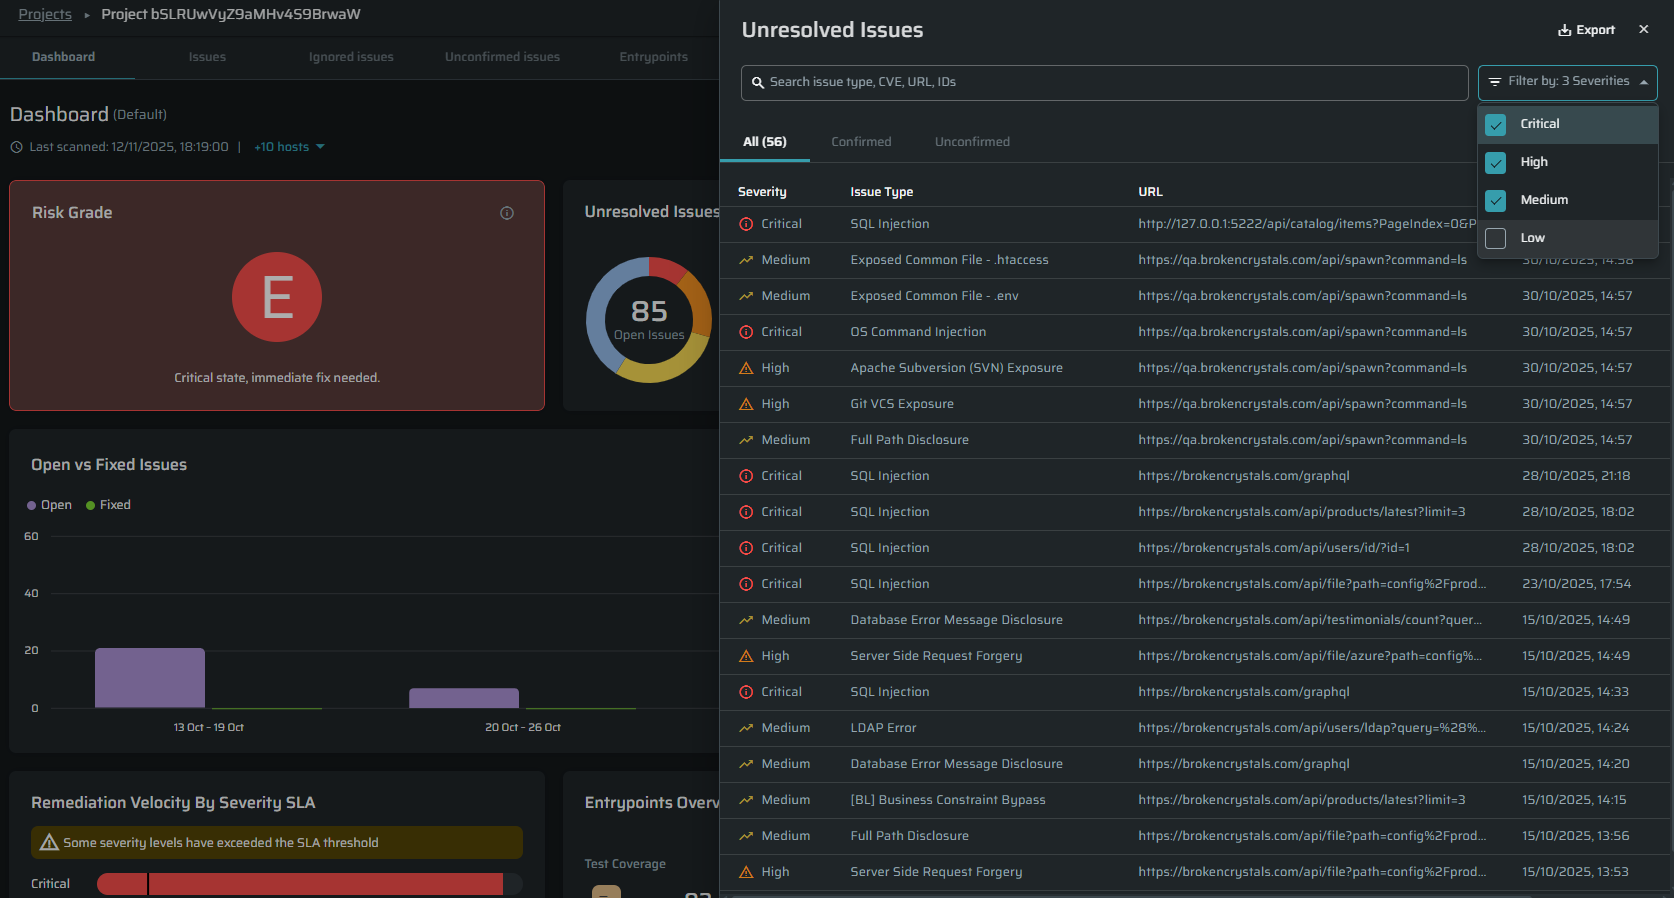
Drawer Details Include:
- Severity – Severity level of the issue.
- Issue Type – Vulnerability category.
- URL – Affected endpoint.
- Discovered On – When the issue was first detected.
- Last Seen – When the issue was last confirmed in Bright scans.
- Export – Data can be exported as CSV.
- Search bar and Severity filter
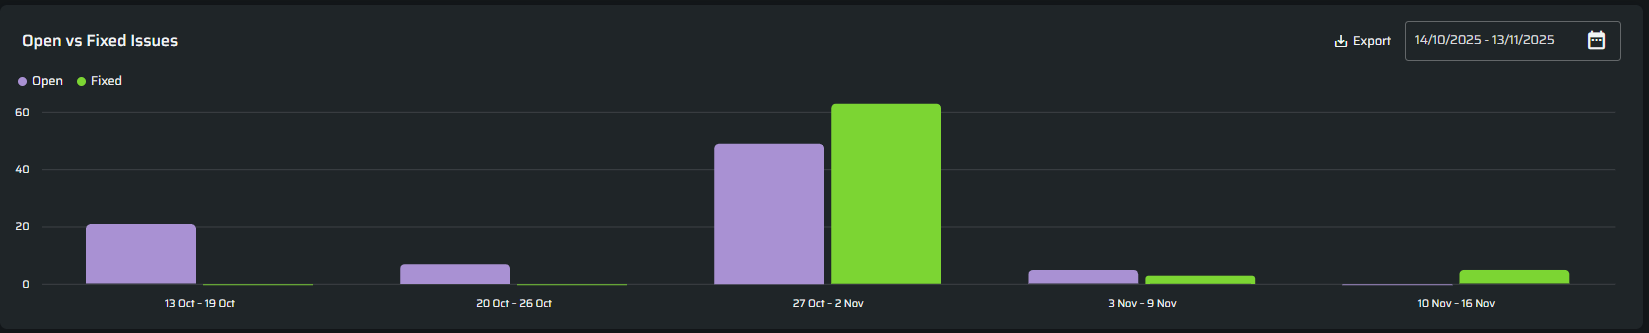
3. Open vs Fixed Vulnerabilities
Tracks remediation trends over time to measure how efficiently vulnerabilities are resolved.
Key Behaviors:
- The “Fixed” bar is affected by issues marked as Resolved in the Issues tab.
- Users can select the desired timeframe and export data as CSV.
- Clicking on a section opens a drawer with detailed data per timeframe.
Drawer Includes:
- Name - Issue type.
- Issue URL
- Severity
- Status
- Last Change Date
- Discovered On
- Last Reported On (optional)
- Resolved On (optional)
- Search bar and Severity filter
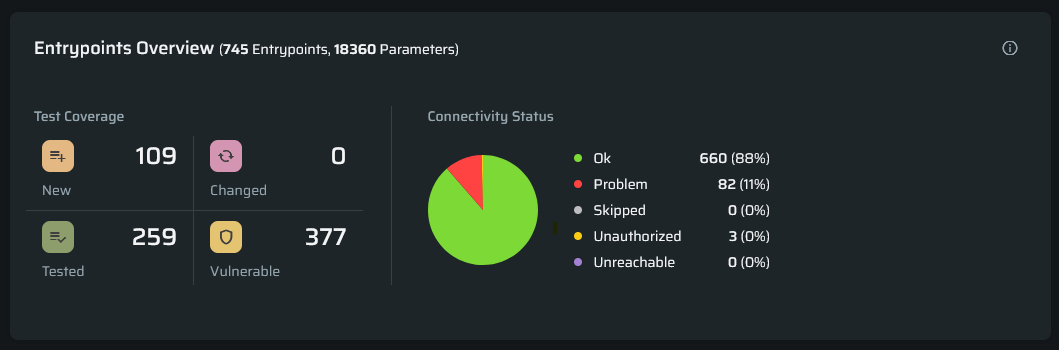
4. Entrypoints Overview
Shows scan coverage and connectivity health across Project entrypoints.
Highlights newly discovered, changed, tested, and vulnerable endpoints to help identify blind spots and ensure scan completeness.
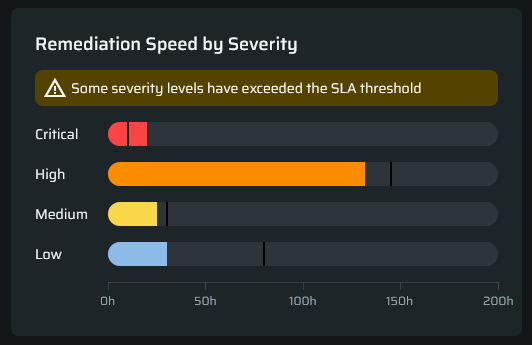
5. Remediation Speed by Severity
Shows the average Mean Time to Remediate (MTTR) per severity compared to defined SLA targets.
Behavior:
- Hover over a bar to see actual MTTR vs SLA.
- Clicking on a Bar redirects to a filtered view of issues by severity.
- SLA breaches trigger an alert notification inside the widget.
- SLAs can be edited at any time on the Project Settings page.
(see “Configuring SLA” section for more info)
Display States:
- No SLA configured: shows empty state, prompting setup.
- Partial SLA configuration: shows MTTR only for severity types without defined SLAs.
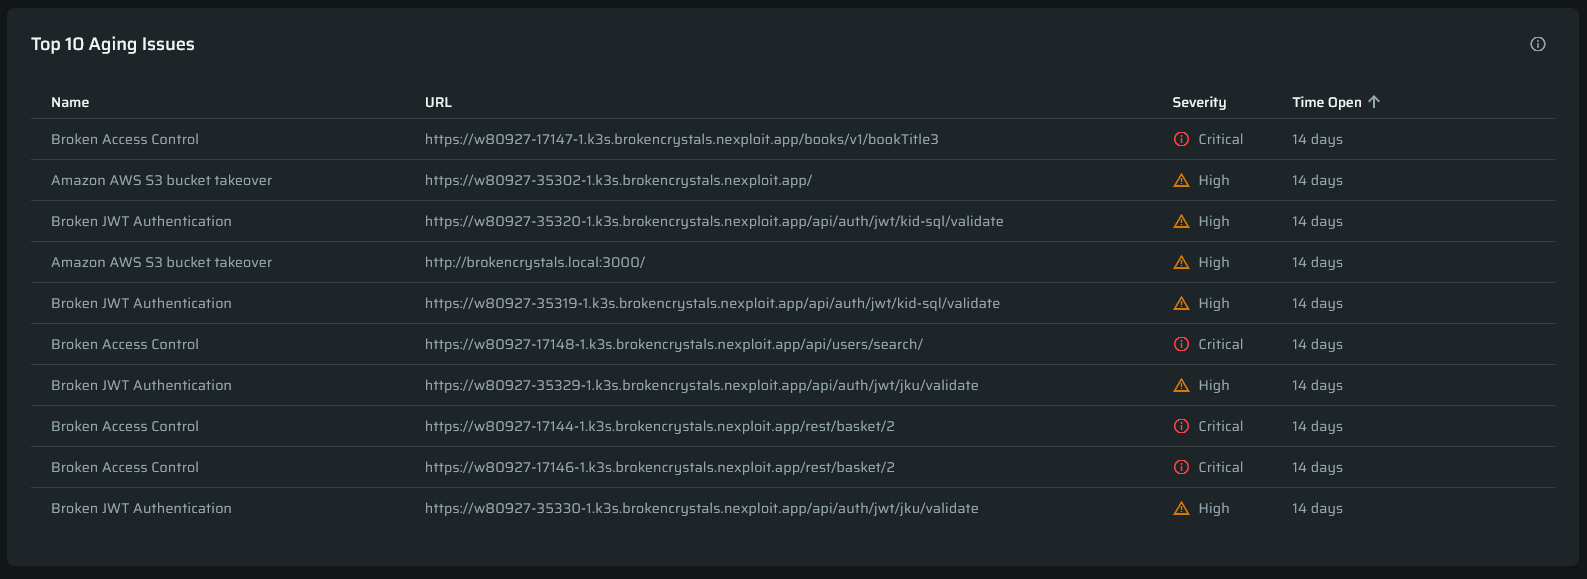
6. Security Debt - Aging Vulnerabilities
Highlights the top 10 vulnerabilities exceeding SLA thresholds.
This widget surfaces long-standing issues that contribute to security debt and helps prioritize overdue remediations.
Behavior:
- Columns are sortable (ascending/descending).
- Clicking an issue redirects to the issue details page.
- SLA thresholds are pulled from Project Settings.
- If no SLA exists, the default threshold is 240h (10 days).
Notes Displayed:
- If no SLA configured:
“No SLA defined – set SLA to replace the 240h default.” - If partial SLA:
“No SLA for [severity types] – set SLA to replace the 240h default.”
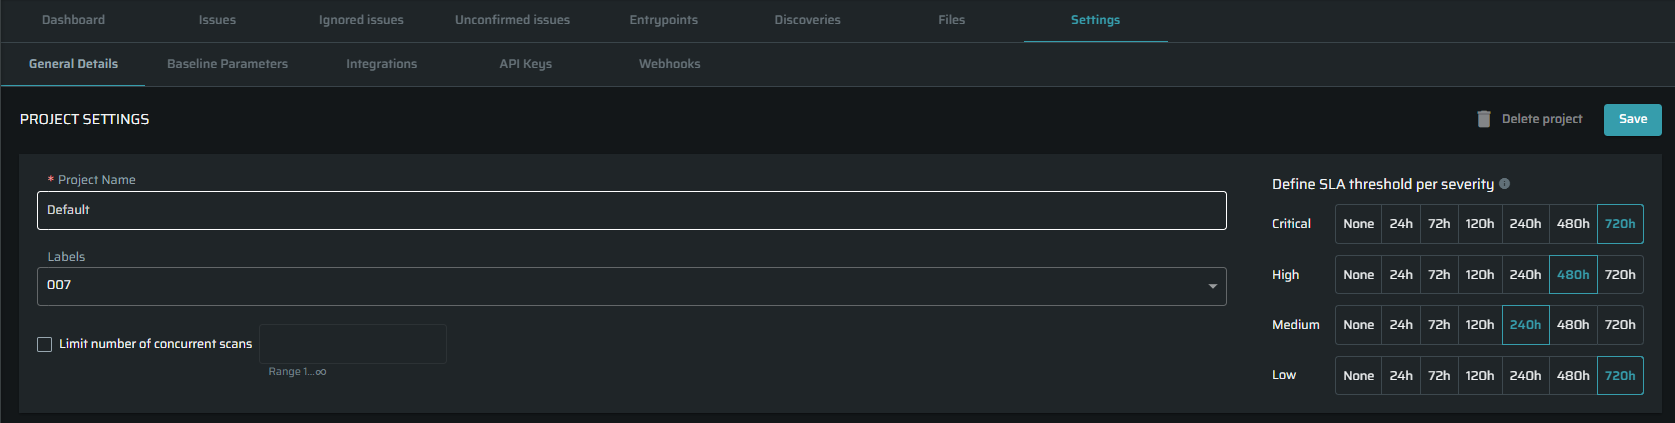
Configuring an SLA
To configure or edit SLAs:
- Go to
Project → Project Settings → SLA Configuration. - Define the desired SLA (in hours) per severity level.
- The SLA values will be applied automatically in the:
- Remediation Speed by Severity widget
- Security Debt widget
Notes:
- SLA setup is optional, but without it, some widgets (like MTTR) will lack data.
- You can define SLAs for specific severity types only.
- This section is editable anytime.
- Required permission:
project.sla:manage.
Viewing the hosts
To see the hosts that are associated with the project, click on the “hosts” button.
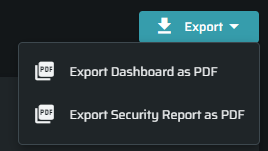
Exporting Data
- Some widgets can be exported as CSV.
- Unresolved Issues
- Open vs Fixed Issues
- The entire dashboard view can be exported as a PDF snapshot.
- Exports reflect current filters and date ranges.
- Exports respect user access permissions and redaction policies.
Empty States & Error Handling
- If no scans were completed yet, widgets will display an empty state message: “No data available -run a scan to generate insights.”
- SLA-related widgets display placeholders if SLAs are not configured (see SLA section).
The Project Dashboard gives AppSec teams a single, data-driven view of their project health.
It combines key security metrics, progress tracking, and SLA monitoring into one interface, helping users prioritize remediation and communicate results efficiently.
Updated 8 months ago