Bright IDE Extension: Developer's Guideline
Workflow
The dual workflows enable effective collaboration between the AppSec team and developers, ensuring secure access to project targets and a smooth integration of security measures into the development process.
Developer Onboarding Workflow
- Extension Installation
Developers install the Bright extension into their Visual Studio Code IDE. - Authentication with an API Key
Using their personal API key provided by the AppSec team, developers authenticate their extension with the Bright platform. This process grants them access to the project's preconfigured target. - Managing Targets
Developers can update target settings to match their environment. - Background Mapping and Testing
Once authenticated, developers can seamlessly work within their targets. The Bright extension operates in the background, enabling them to identify and address vulnerabilities efficiently without external intervention.
1. Prerequisites
You will need Microsoft Visual Studio Code (VS Code) installed to perform the next steps in configuring Bright IDE extension.
2. Extension Installation
Install the extension from the VS Code Marketplace.
3. Authentication with an API Key / Add a new target
Authentication and adding a new target are the same actions. So, to get started successfully, add one target to the extension:
-
Open the extension → Targets List tab → Add a new target
-
Paste the API key provided by the AppSec team
-
Click Add:
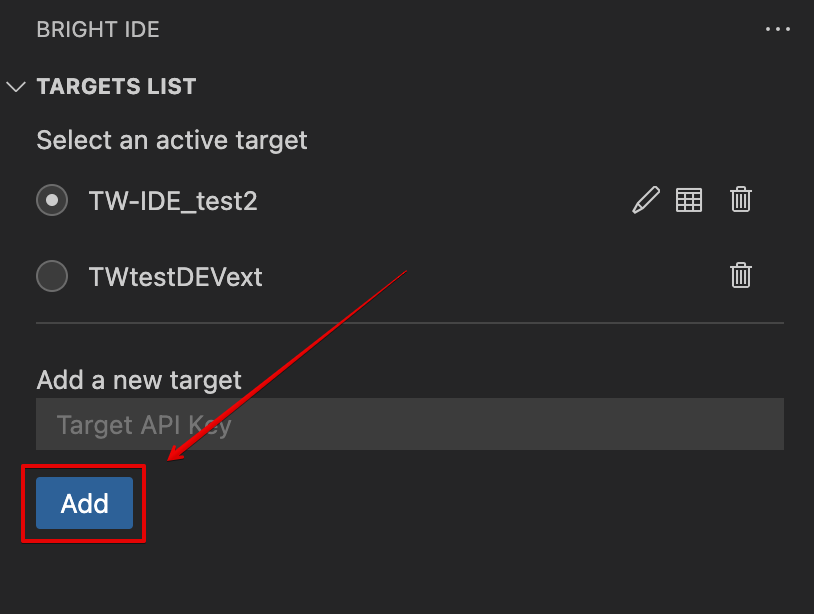
To add a new target, repeat this flow. All targets are displayed in a Targets List.
Well done! You have successfully added one or several targets. See the next topic to learn how to switch between them.
4. Managing Targets
Switch between targets
To start or continue working on another target, you need to switch to it to ensure the scan settings are updated accordingly. Selecting the relevant targets from the target list:
-
Open Targets List tab
-
Select a target by clicking the radio buttons:
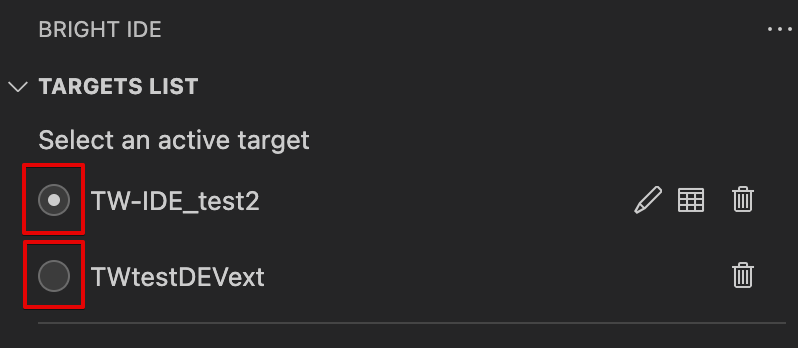
Done! Now, the other target is being used.
Delete a target
To delete a target, do the following:
-
Open Targets List tab
-
Click on the trash icon near the target you want to delete
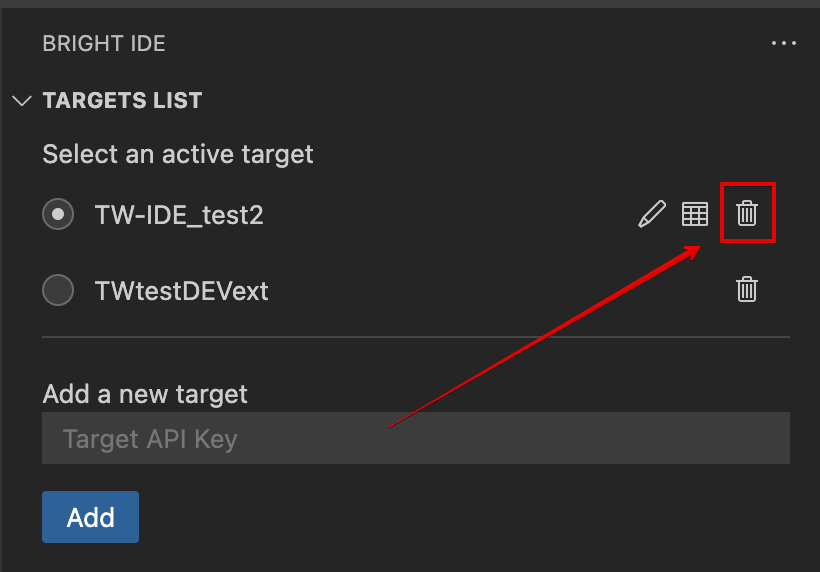
Done! The target has been deleted.
Update Target Settings
You can update target settings for a different start command, stop command, or URL. This page also helps debug target verification issues.
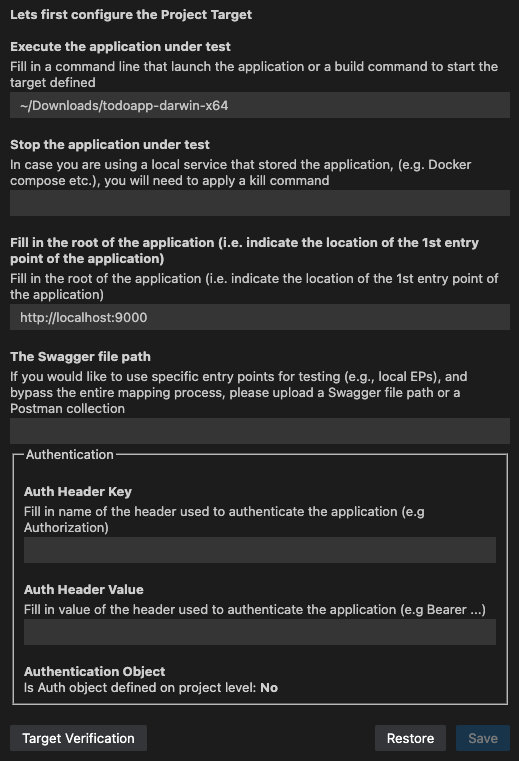
Execute the application under test
The start command for executing the app under test runs in the default OS shell: bash for MacOS and Linux, and CMD for Windows.
Stop the application under test
The standard procedure for closing a target involves terminating the parent process in the Shell. When the Shell window closes, the parent process is killed, but child processes, like Docker containers, might not stop automatically.
To ensure proper termination:
- Open the target and close the Shell window.
- If the target continues running, add a stop command.
Ensure that any specified stop command makes the start command disappear after launch, preventing it from running in the background.
For example, use docker run --name nginx-container -d nginx for Docker.
Authentication
Auth Header Key and Auth Header Value fields are being used to overwrite any existing predefined authentication. A developer can add his own header key and header value, which will be used during the scan instead of the defined authentication object.
Target Verification
What Target Verification button does:
- Verification of Start and Stop Commands: The running target is terminated, a new target is started, and then it is stopped again.
- Testing the Authentication Object: The authentication object attached to the project is tested to ensure it works correctly.
Once it's ready, a notification will appear about whether the target is available or how to make it available, if needed.
Use the Restore button to load the default settings provided by the AppSec team, or click Save to keep these settings.
5. Background Mapping and Testing
Start Testing or Mapping
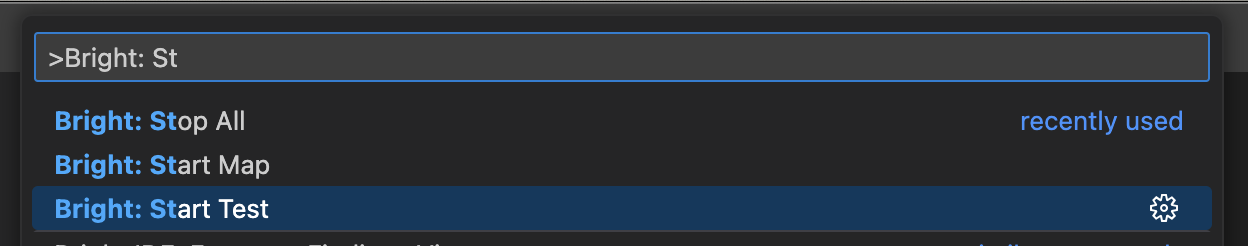
Use these shortcuts to open the Command Palette:
- MacOS:
Command + Shift + P - Windows:
Control + Shift + P
Use these commands to interact with the extension manually:
- Start Map - start mapping manually after local code changes. Needs to be run when no Entrypoints are shown in the "Entrypoints" table.
- Start Test - start testing manually. By default, the testing starts right after the mapping process.
- Stop All - stops all running scans and terminates the local running target
Entrypoints & Tests
Using the Bright IDE Extension, developers can select existing Entrypoints from the Bright project for local use or add new ones. Once an app is crawled publicly, the results are shared across local environments. To start scanning a local web app instantly, reuse the public app’s entrypoints.
Select existing Entrypoints
To select existing Entrypoints, do the following:
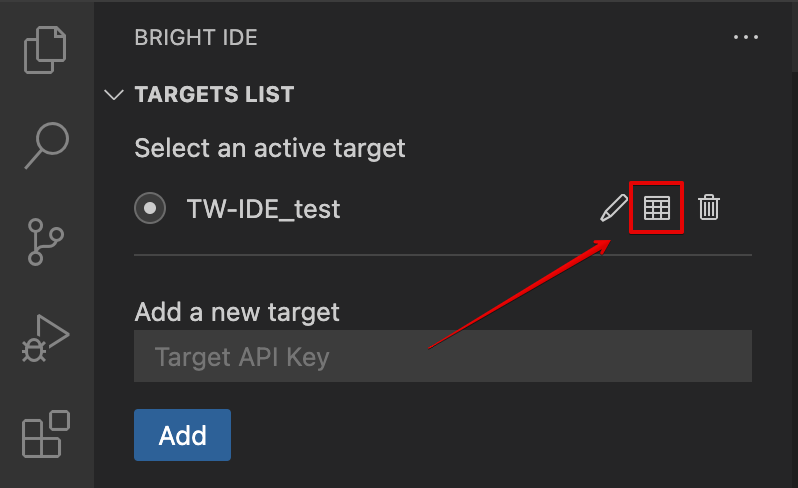
-
Click on the icon near the list of targets:
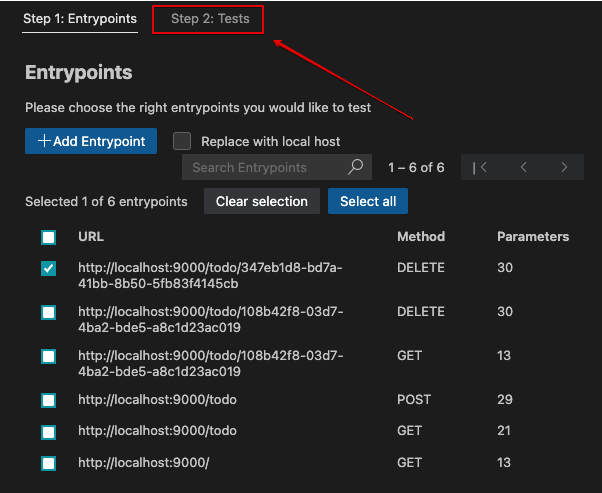
-
Select at least one Entrypoint from the Step 1: Entrypoints tab, and click on the "Step 2: Tests" tab to proceed.
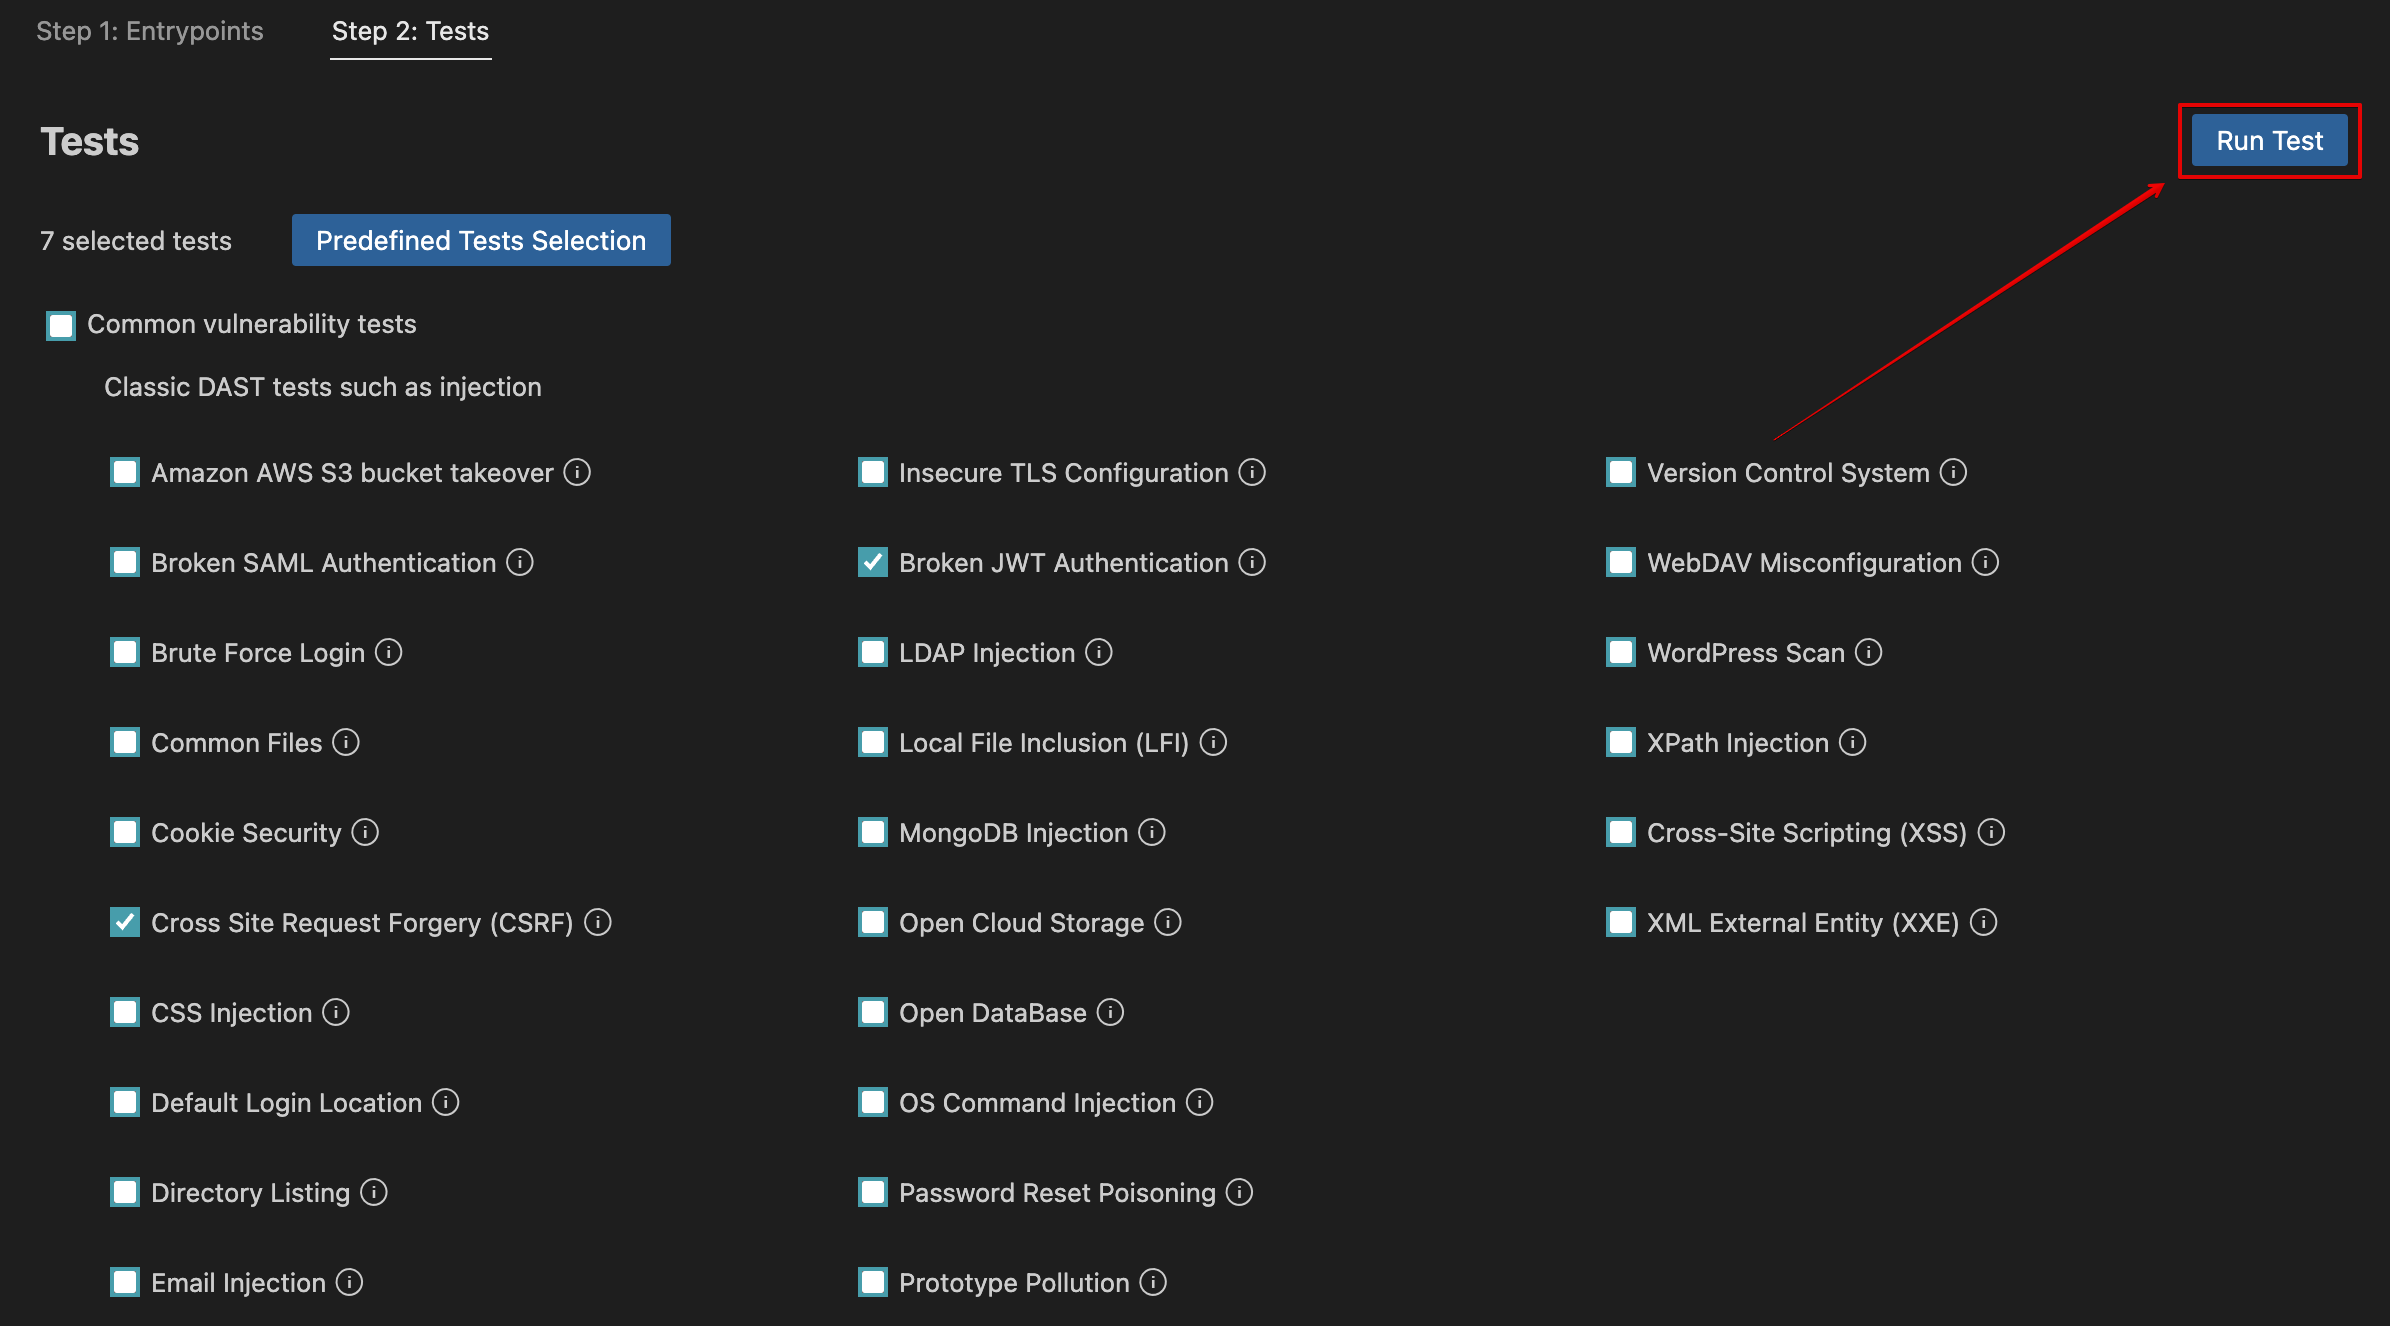
-
Select relevant tests from the list manually or click the Predefined Tests Selection to select predefined tests for this target. Click Run Test to proceed.
-
You'll see a notification informing you that the test has been started successfully. Issues are displayed during the scan as they are being found and will appear on the Last Scan Findings panel. Also, the Dev Centric extension allows a developer to observe a list of all Project findings below.
-
After editing the code, select an issue (or issues) from the list to retest the target and click Retest (available both for the Last Scan Findings and the Project Findings tables). This action focuses on the specific vulnerability of the entrypoint where it was found.
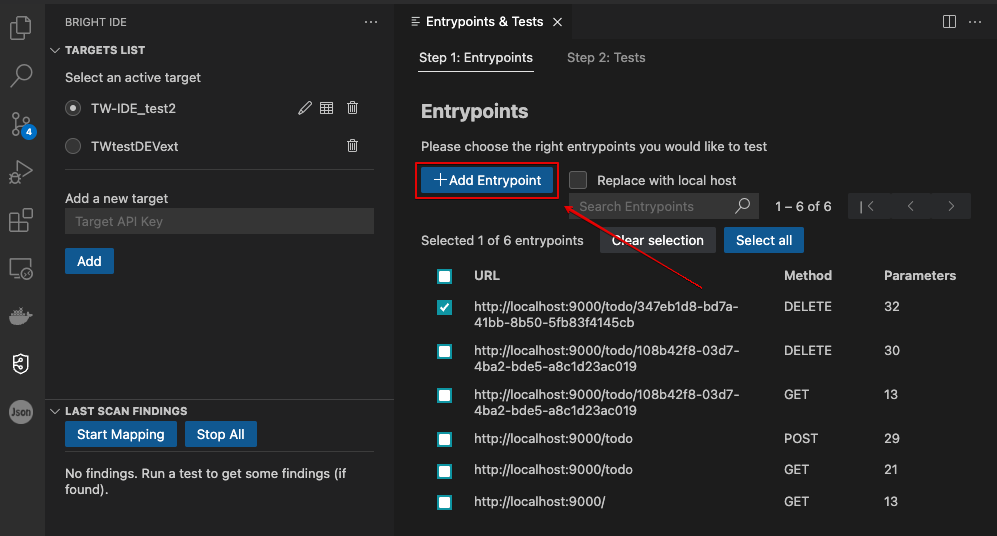
Create a new Entrypoint
Ensure full coverage of your web app by adding new Entrypoints manually right from your extension.
To add a new Entrypoint within the extension, do the following:
-
Click on the icon near the list of targets:
-
Click +Add Entrypoint:
-
Select a method and provide a URL to complete the process. Additionally, you can add headers and body. To complete the process, click Save.
Replace with local host URLs
In the Entrypoints & Tests dialog box, select Replace with local host to substitute the public URL with your local URL.
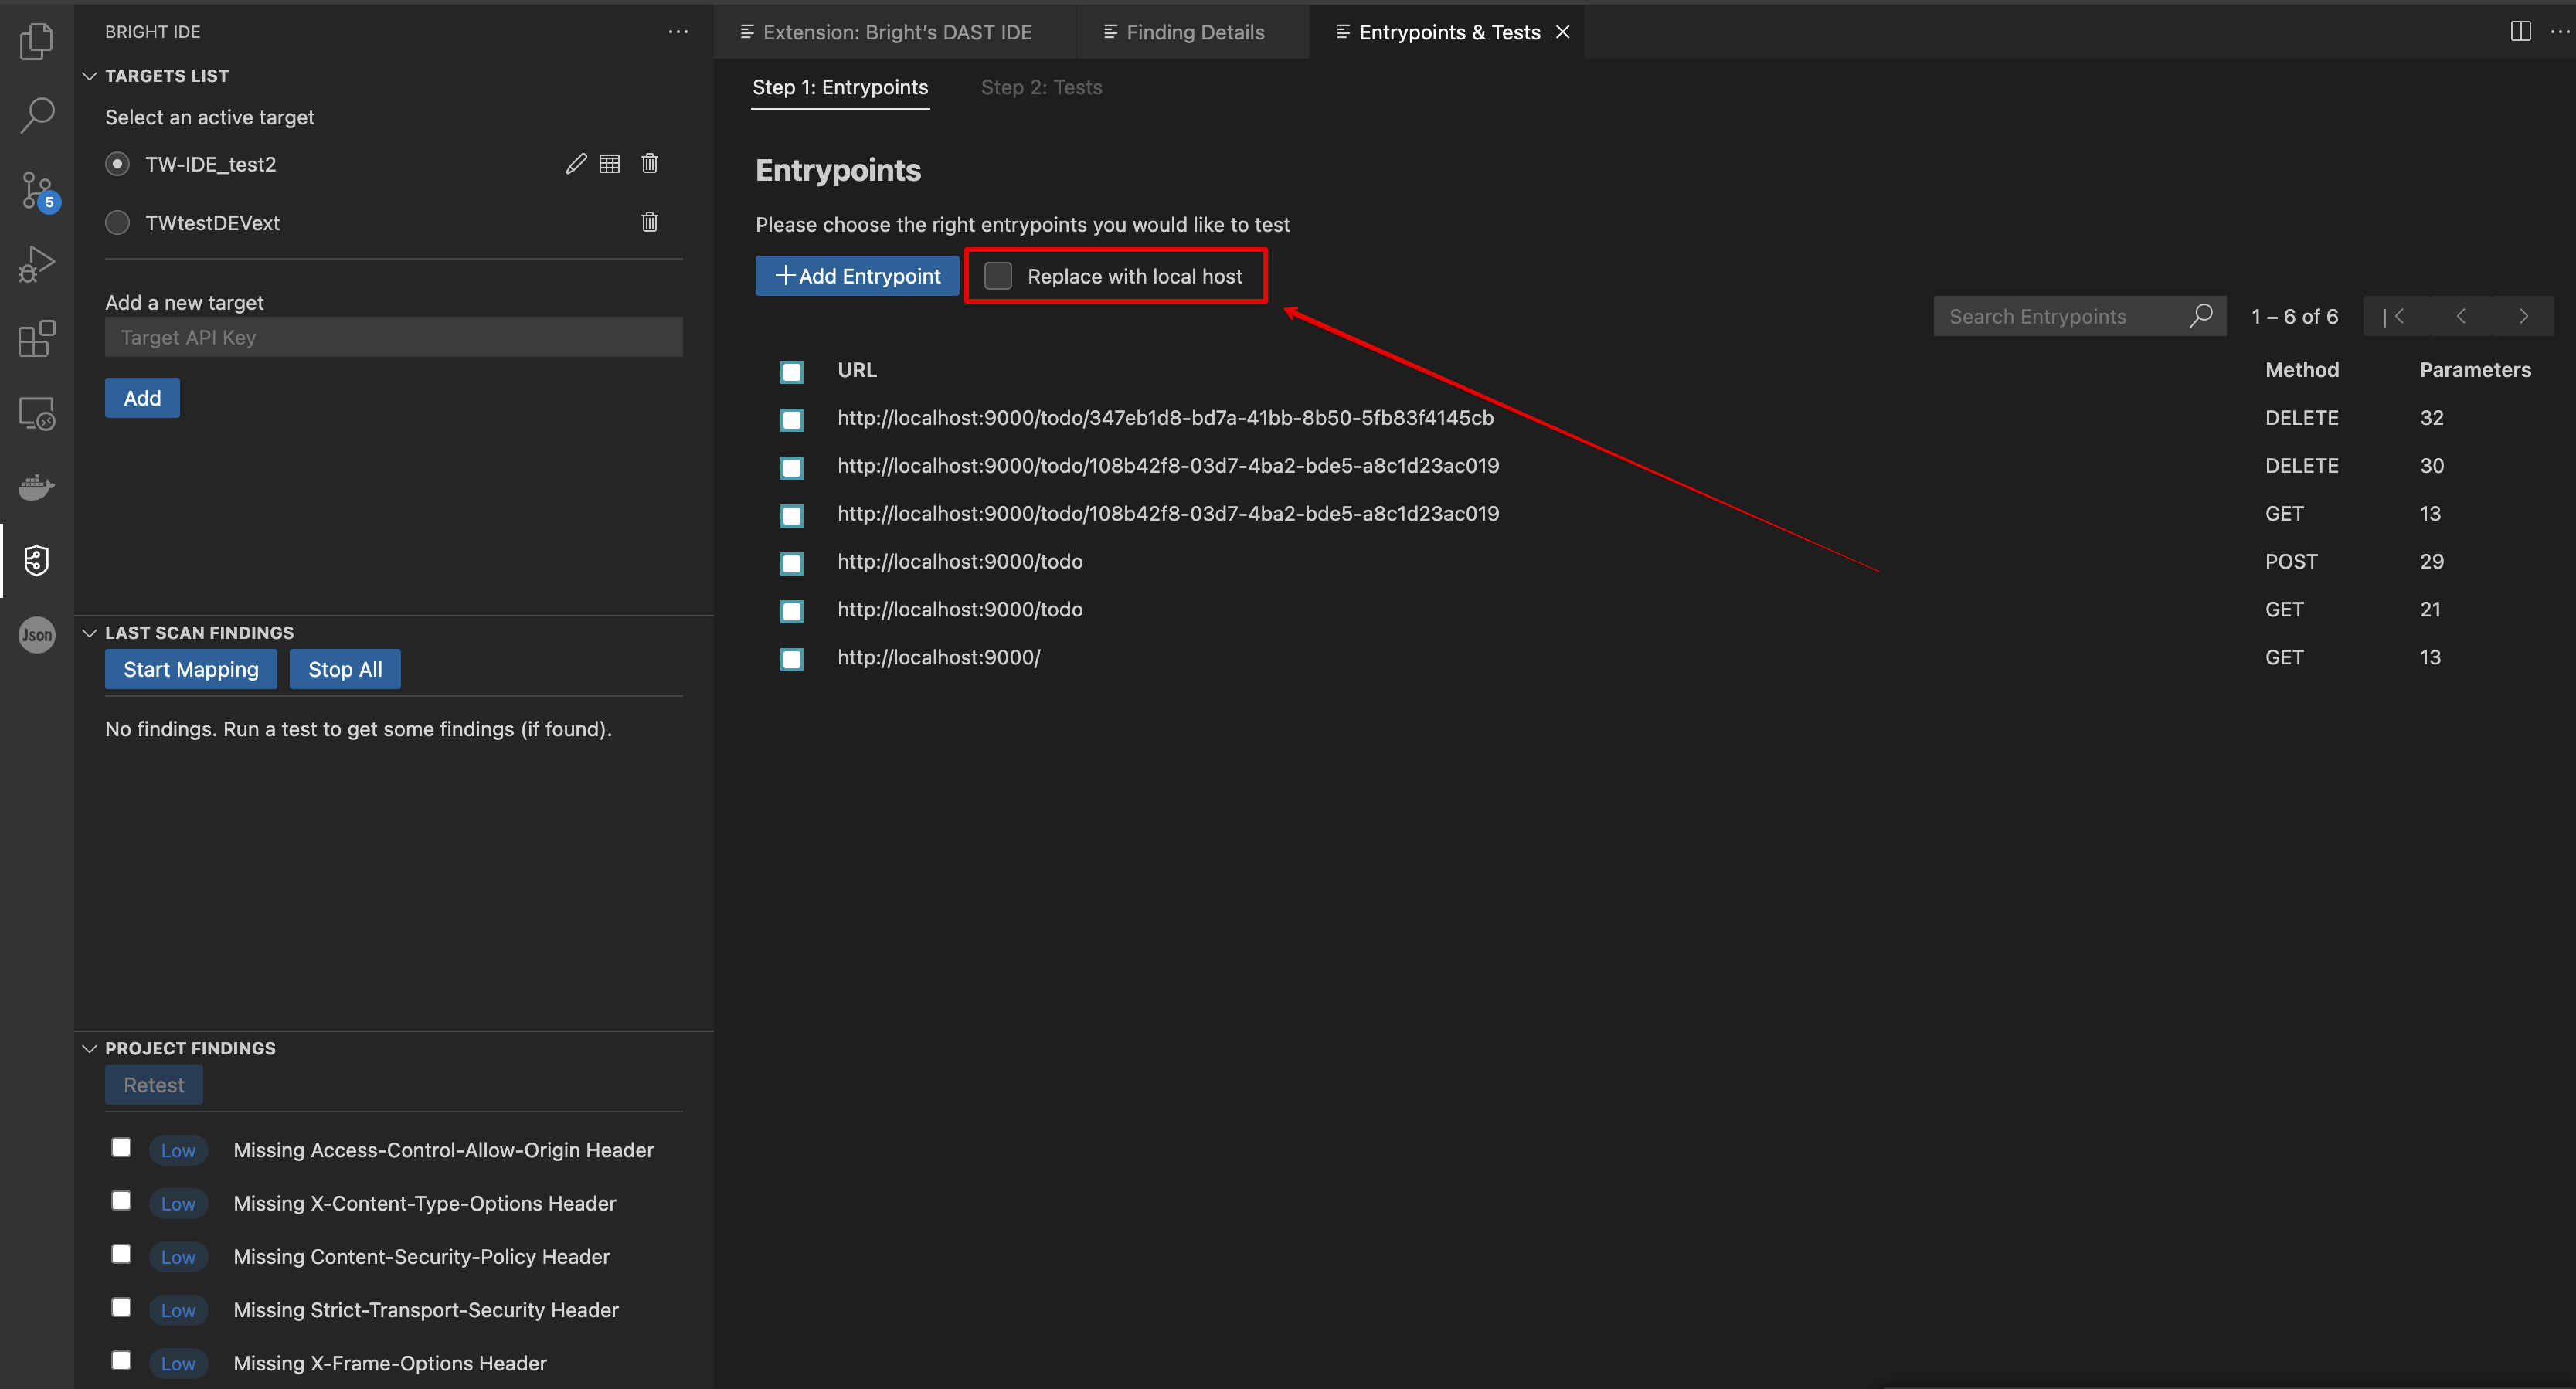
Example:
https://brokencrystals.com/api/products(public URL)
http://localhost:8090/api/products(local URL)
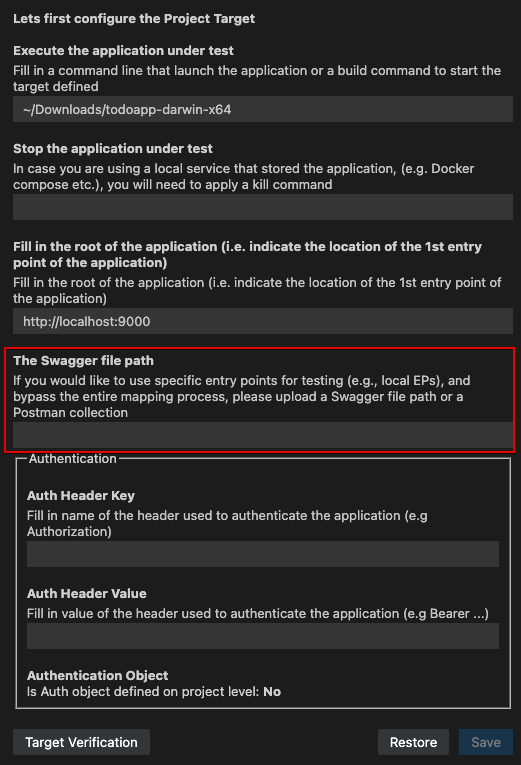
Working with swagger file/Postman collection
A developer can work with his specific swagger file or a local Postman collection.
Once a local path or a publicly accessible URL is provided, and the Save button is clicked, the extension will process the API endpoints from the provided file - and they will be shown in the Entrypoints table for the developer to choose from.
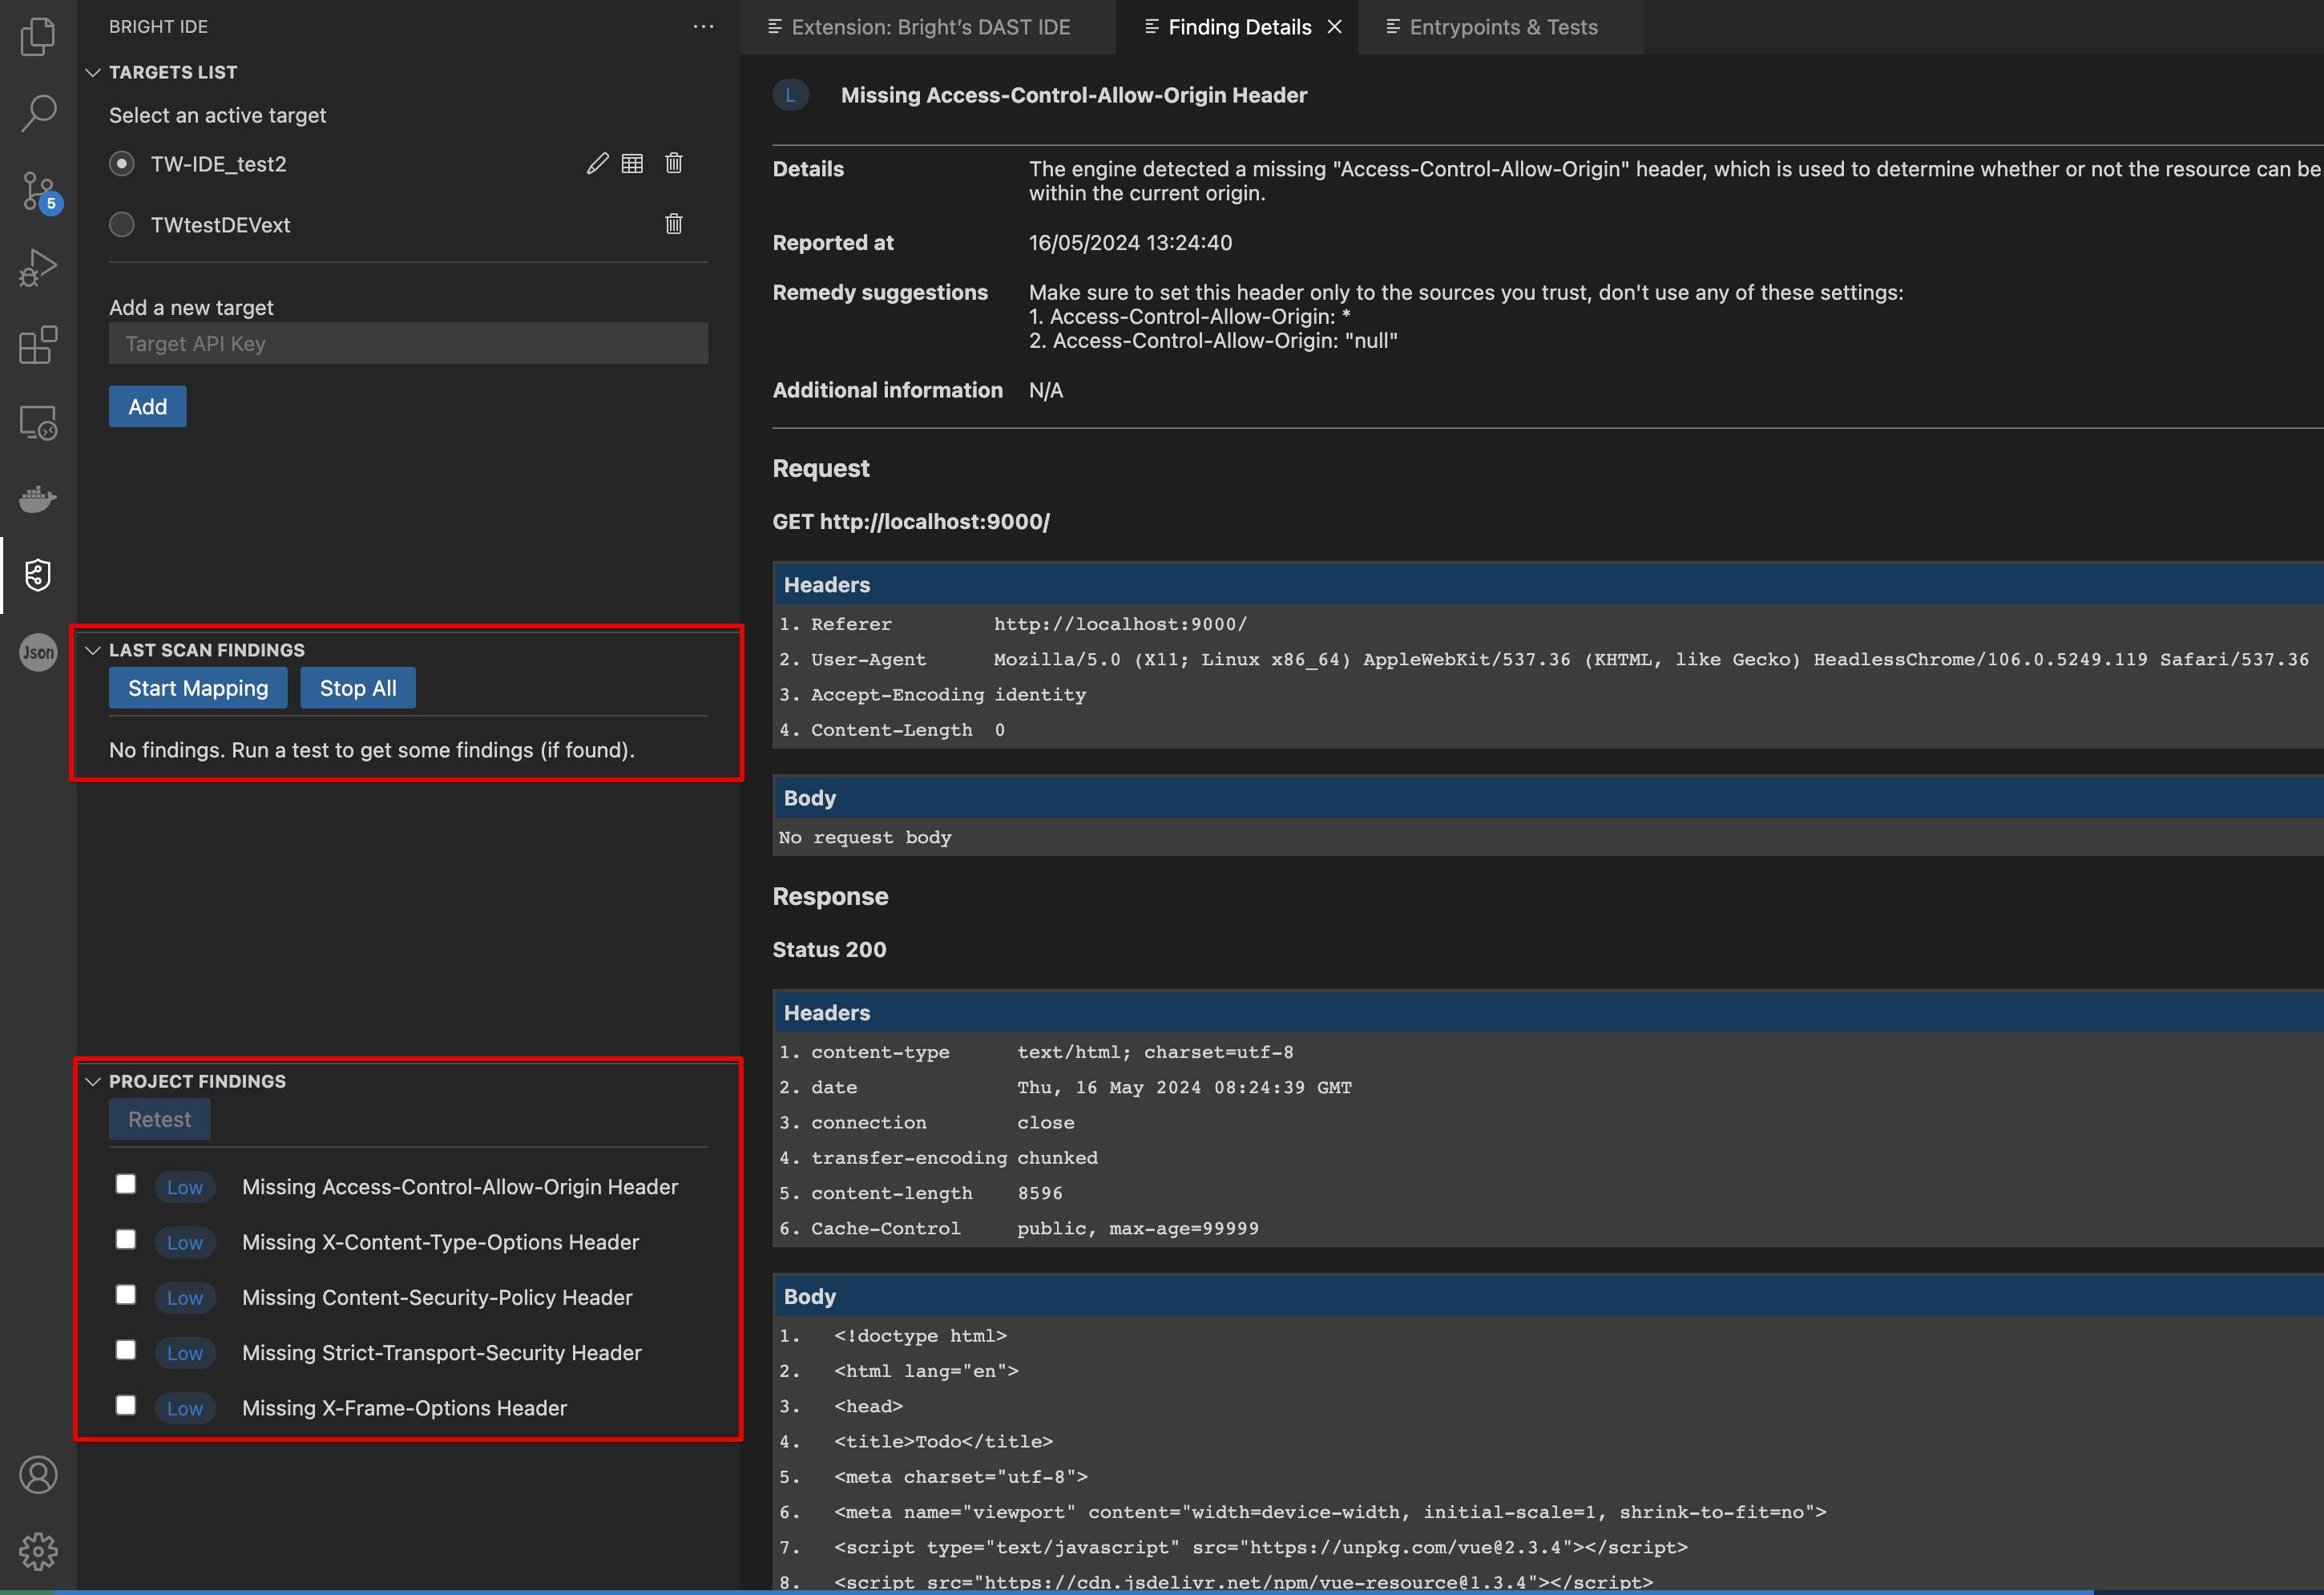
Findings Details
Within VS Code, the extension summarizes all findings and their severities from a test. To access the findings, open the Findings Tab on the left sidebar. This allows developers to view all necessary details to resolve issues directly within the extension.
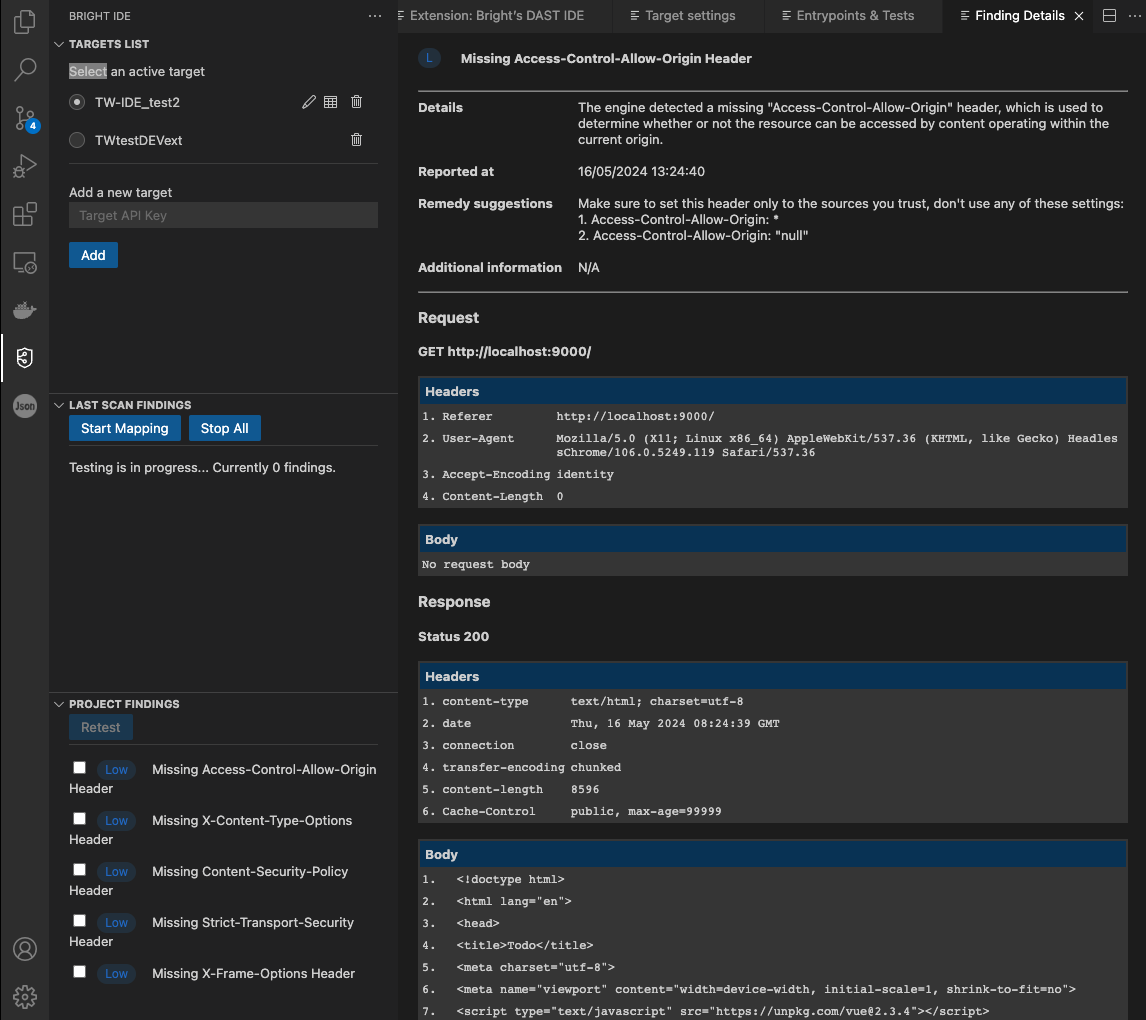
To open finding details, go to the Findings tab on the left corner and select a finding to view more details. This page consists of the following parts:
- Details
- Reported at
- Remedy suggestions
- Additional information
- Request
- Response
Updated about 1 year ago