Bright IDE Extension: Full Manual
Configuration
Introduction
Bright Dev-Centric DAST integrates vulnerability detection directly into the development process. It offers an IDE extension, allowing developers to conduct security tests, such as Visual Studio Code, in their usual working environment. This enables immediate attack simulations post-development to ensure new code is secure, either as part of the Pull Request process or alongside it. Security findings are displayed within the IDE with detailed vulnerability proofs. Additionally, DevSecOps teams can incorporate critical scans into the CI/CD pipeline for enhanced build security.
The value for organizations adopting this methodology is straightforward:
- Identify vulnerabilities early in the development cycle when there is time to remediate and avoid pushing known vulnerabilities to production.
- The developers are not required to learn a new tool or have a context switch - the DAST capabilities are available within their day-to-day working environment.
- Improved collaboration and transparency between the developers team and the AppSec team.
- Executive visibility for the application security posture as it is being developed.
Bright DAST streamlines application security by identifying potential attack surfaces like application entrypoints, microservices, or APIs. It uses automated crawlers or API schemas for discovery, allowing developers or the AppSec team to initiate this within the IDE. Developers can select specific entrypoints for simulated attacks and customize tests based on pipeline stages. These tests involve manipulating requests and analyzing responses for vulnerabilities like unintended data exposure. Findings, including vulnerability proof and actions taken, are displayed in the IDE, with severity levels aiding in prioritization. Post-remediation, retesting validates fixes, aligning with test-driven development methodologies. This approach significantly enhances the application's security posture, enabling rapid, secure software release.
Bright Web App Configuration
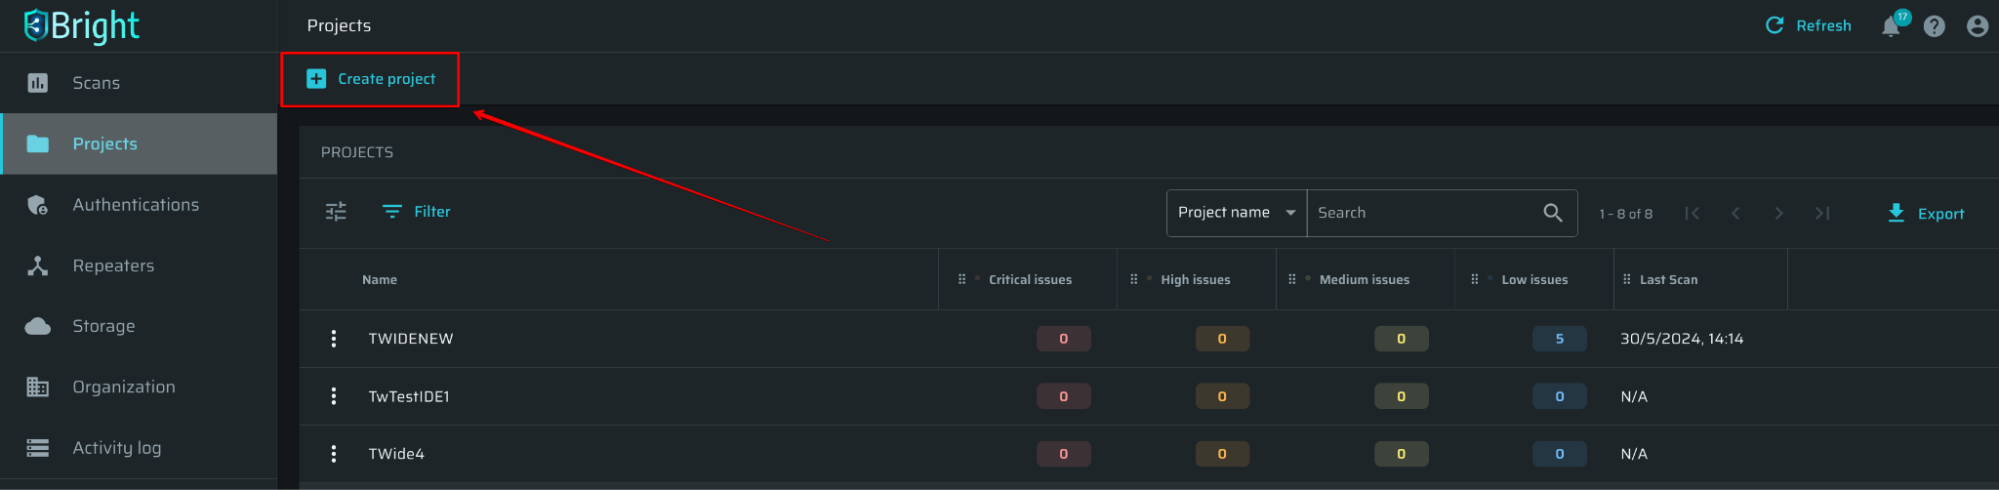
How to Create a Project
Creating a Project is the best way to separate and manage scanning flows.
A project is required to configure a new scan, so if you don’t have any custom projects, select the Default one.
To create a project, follow these steps:
-
In the left pane, select Projects and click +Create Project:
-
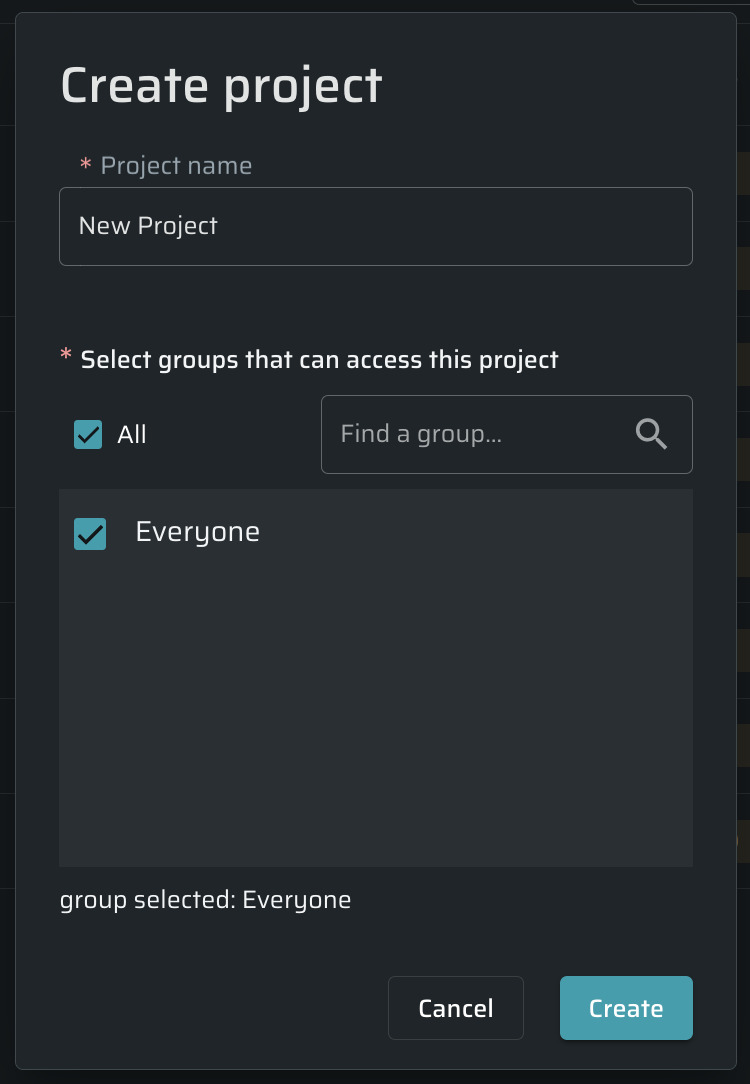
In the Create Project dialog box, enter a project name and select the groups that can access the project.
-
Click Create.
A successfully created project appears in the PROJECTS table.
Dev-Centric Project Settings
To configure the Dev-Centric Project settings, follow these steps:
a. Open the Bright web app → Projects page → open a project or create a new one
b. Click on the Settings button in the upper right corner
c. Scroll down to the DEVELOPER EXTENSION section. If you can't see this section, it needs to be enabled by your organization administrator (Admin panel → Organization Settings → Permissions → Developer Extension).
Mark the Enabled checkbox to open the extension settings for editing.
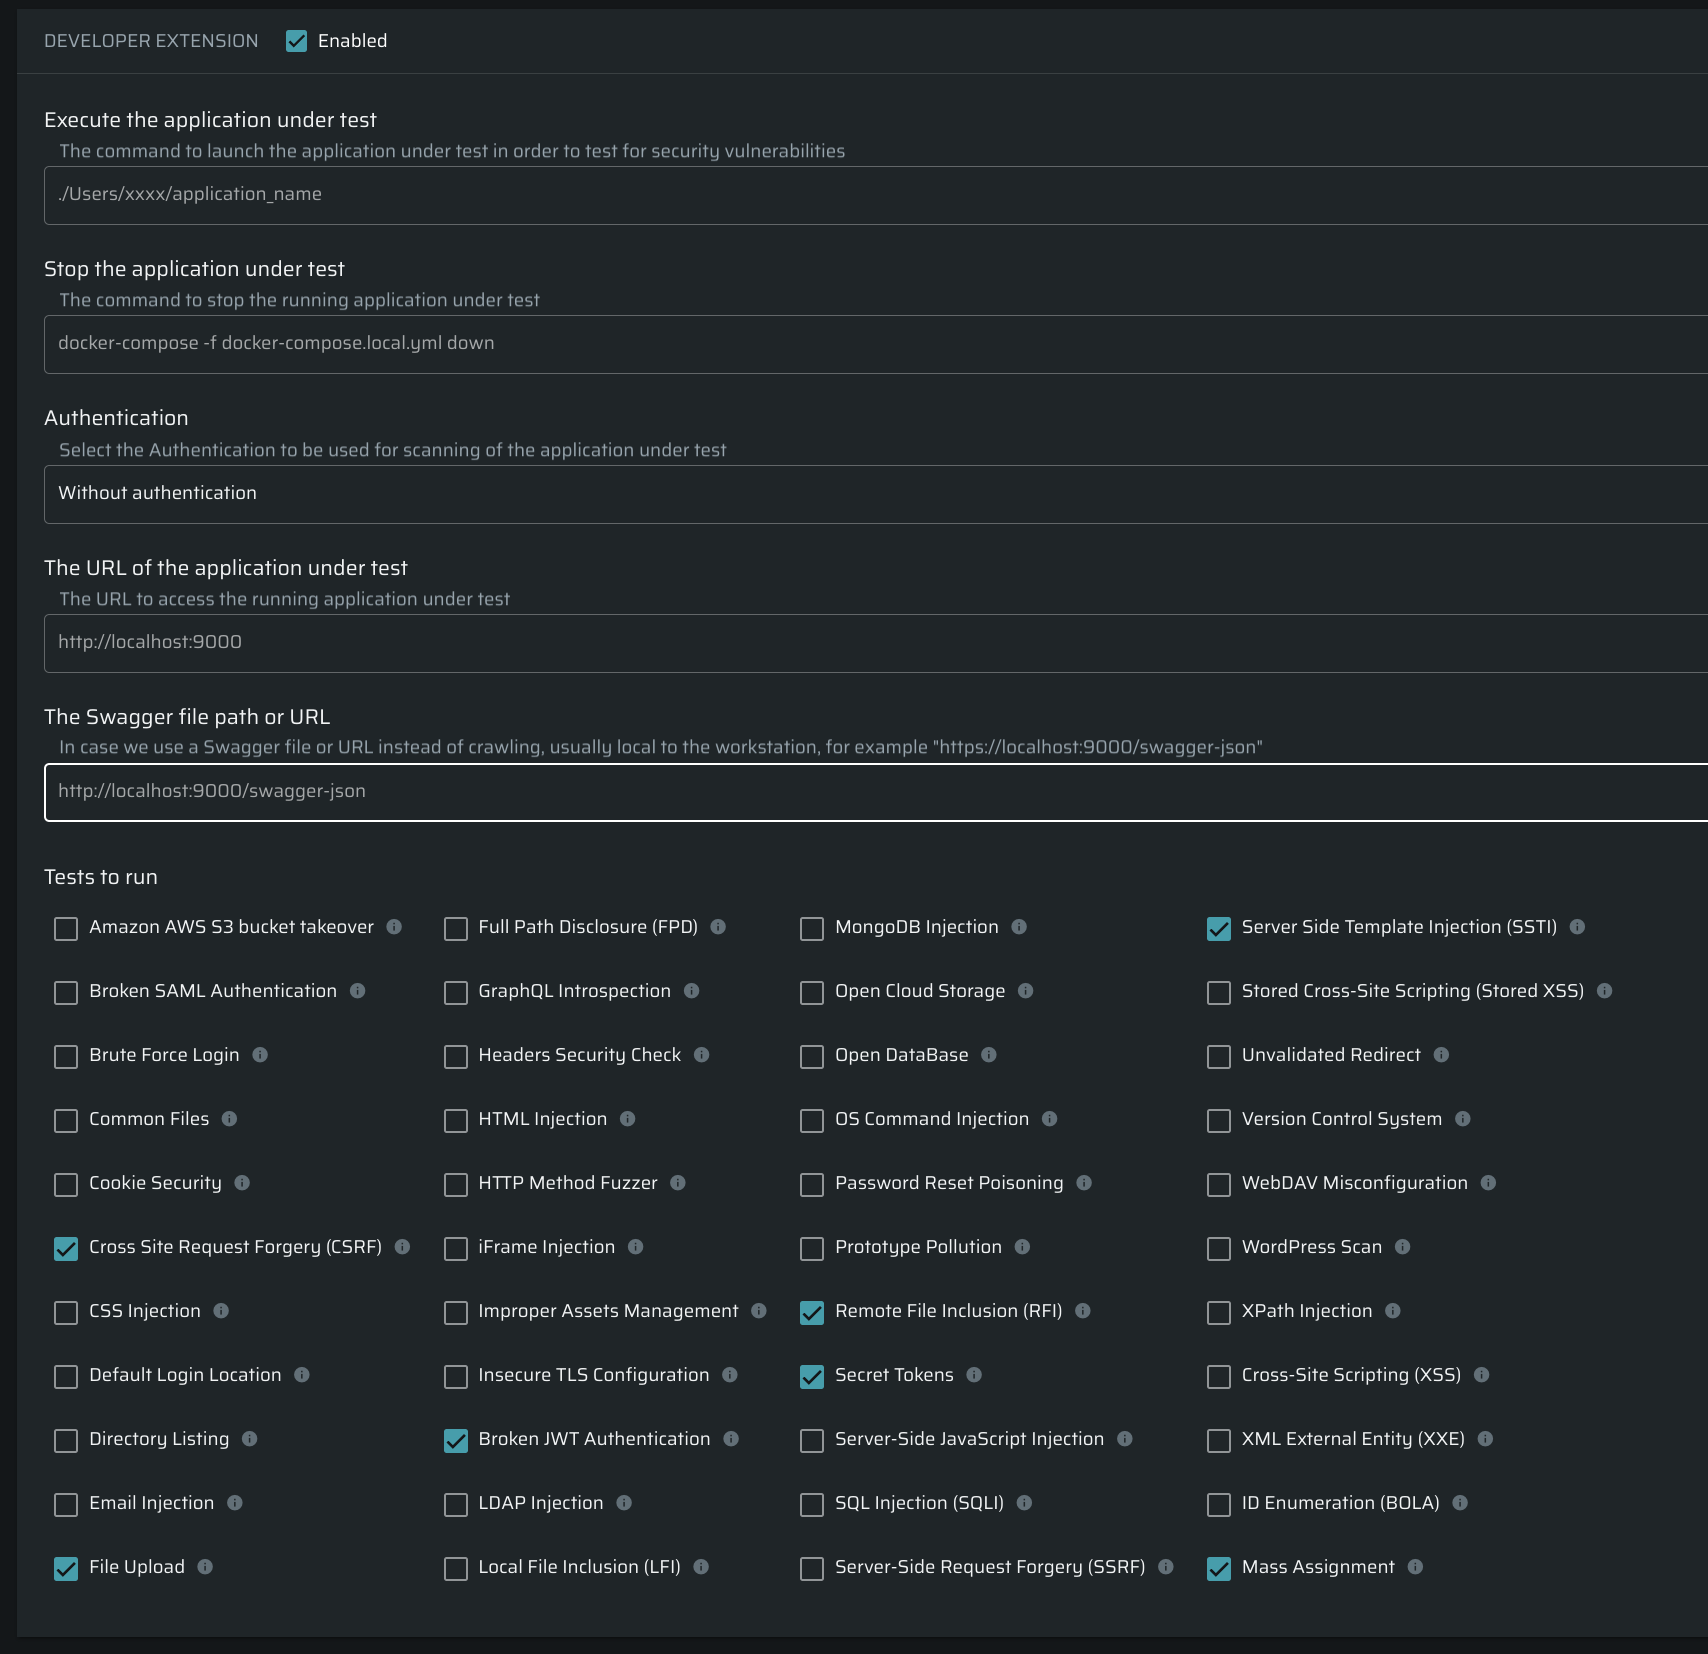
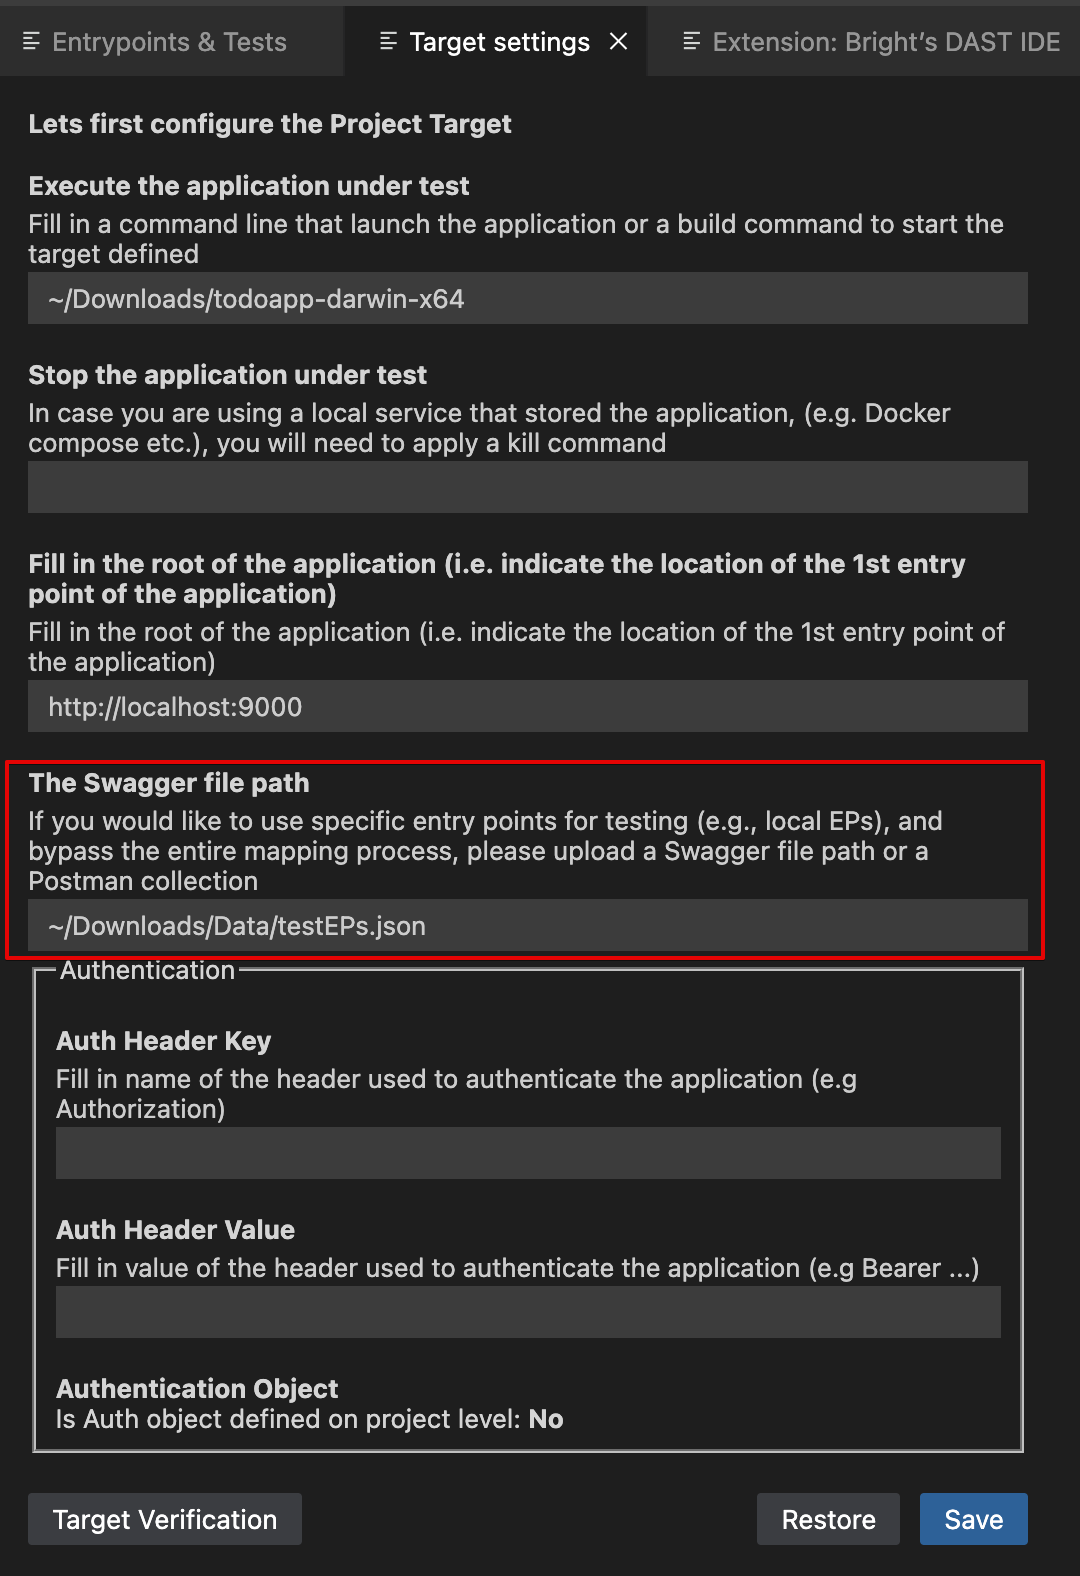
The settings consist of the following options:
- Execute the application under test – The start command for executing the app under test runs in the default OS shell: bash for MacOS and Linux, and CMD for Windows, e.x.
npm run start. Required - Stop the application under test – The standard procedure for closing a target involves terminating the parent process in the Shell. When the Shell window closes, the parent process is killed, but child processes, like Docker containers, might not stop automatically.
Ensure that any specific stop command terminates the start command after launch, preventing it from running in the background.
For example, use
docker run --name nginx-container -d nginxfor Docker. - The URL of the application under test – the local URL to start crawling with, e.x. https:// 12.0.0.1:9000. Required
- Authentication – in case authentication is needed to access the target. An authentication object contains credentials and info about the authentication flow and re-authentication triggers of assets in the current project.
- The Swagger file path or URL – If added, will use the provided data instead of crawling.
- Tests to run – A list of tests available. Required
Connect your project to the Bright IDE extension
Create API keys
Generate project API keys to connect IDE extensions with project targets:
-
In the Project settings, scroll to the MANAGE YOUR PROJECT API KEYS section
-
Click +Create API key
-
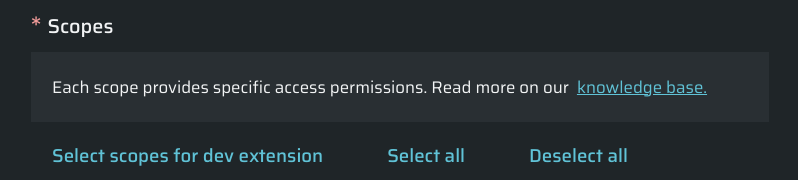
Choose the Select scopes for dev extension button, which pre-selects the needed permissions:
-
Click Create to continue
Extension Installation
Install the extension from the VS Code Marketplace.
Dev-Centric Target Settings
How to manage targets
Add a new target
Authentication and adding a new target are the same actions. So, to get started, add your first target to the targets lists:
-
Open the extension → Targets List sidebar → Add a new target
-
Paste the API key created in the Bright web app (or provided by the AppSec team)
-
Click Add:
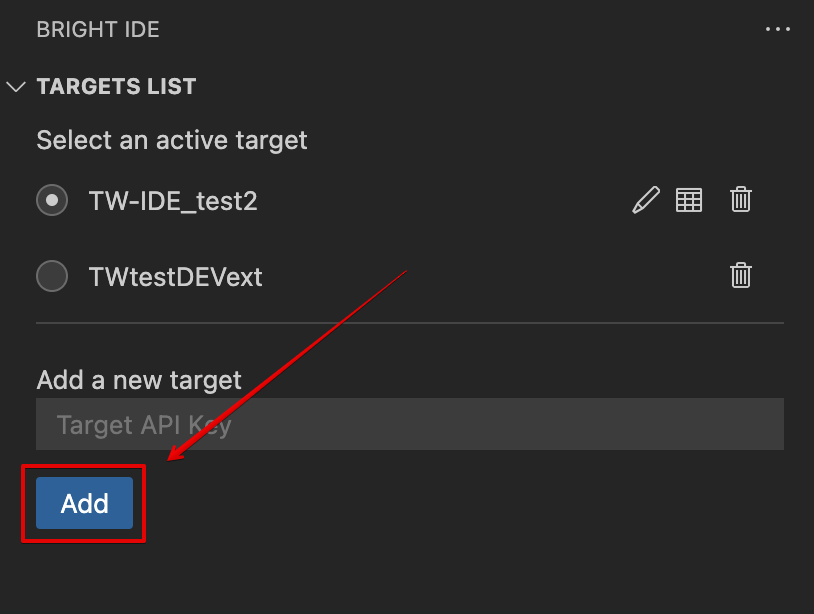
To add a new target, repeat this flow. All targets are displayed in a Targets List.
Well done! You have successfully added one or several targets. See the next topic to learn how to configure and update them.
Update
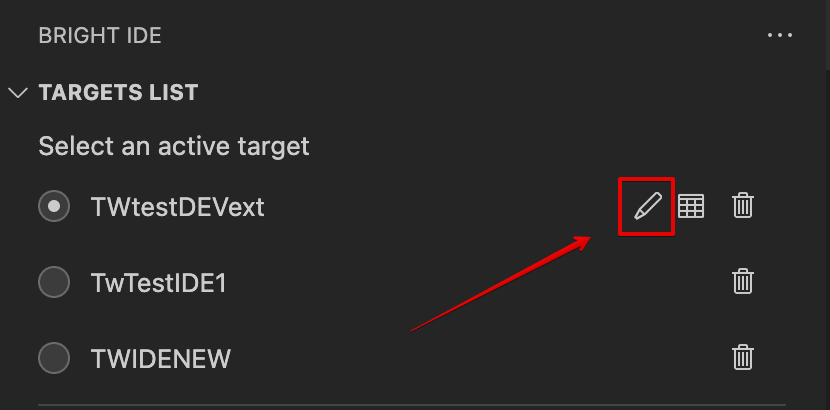
You can update target settings with a different start command, stop command, or URL. This page also helps debug target verification issues.
To get to the target settings, do the following:
-
Open the Targets List sidebar
-
Click on the following icon near the target you want to update:
Execute the application under test
The start command for executing the app under test runs in the default OS shell: bash for MacOS and Linux, and CMD for Windows (optional).
If no start command is provided, the process will not start automatically, allowing users to initiate their target manually. This is useful for users who need to run complex scripts or deal with issues preventing automatic startup.
Stop the application under test
The standard procedure for closing a target involves terminating the parent process in the Shell. When the Shell window closes, the parent process is killed, but child processes, like Docker containers, might not stop automatically.
To ensure proper termination:
- Start the target and close the Shell window.
- If the target continues running, add a stop command.
Ensure that any specific stop command makes the start command disappear after launch, preventing it from running in the background. For example, use docker run --name nginx-container -d nginx for Docker.
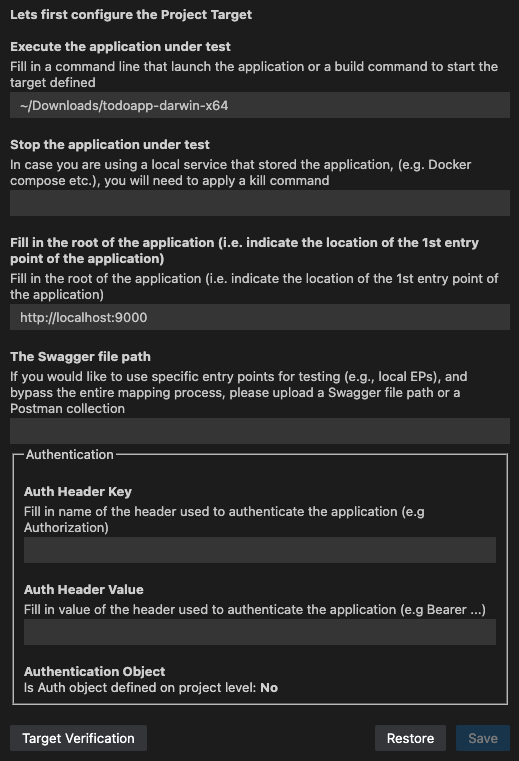
Authentication
The Auth Header Key and Auth Header Value fields allow users to override preconfigured authentication settings in the Bright web app using their own headers during a scan.
Target Verification
What the Target Verification button does:
- Verification of the Start and the Stop Commands: The running target is terminated, a new target is started and then terminated again.
- Test of the Authentication Object: The authentication object attached to the project is tested to ensure it works correctly.
Once it's ready, a notification in VS Code will appear about whether the target is available or how to make it available, if needed.
Click Save to keep these settings, or use the Restore button to load the default settings.
Switch
To start or continue working on another target, you need to switch to it to ensure the scan settings are updated accordingly. Selecting the relevant targets from the target list:
-
Open the Targets List sidebar
-
Select a target by clicking the radio buttons:
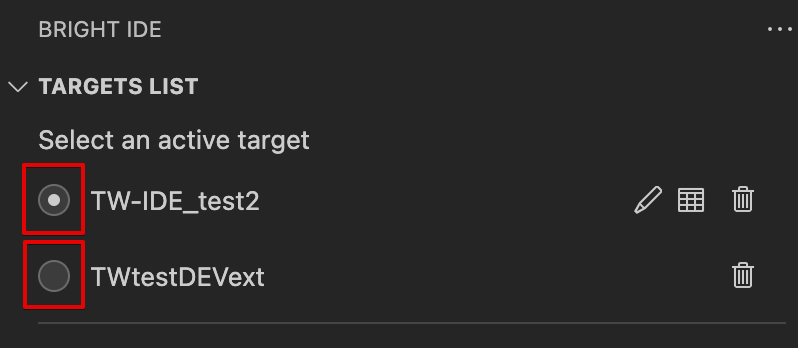
Done! Now, the other target is being used.
Delete
To delete a target, do the following:
-
Open the Targets List sidebar
-
Click on the trash icon near the target you want to delete:
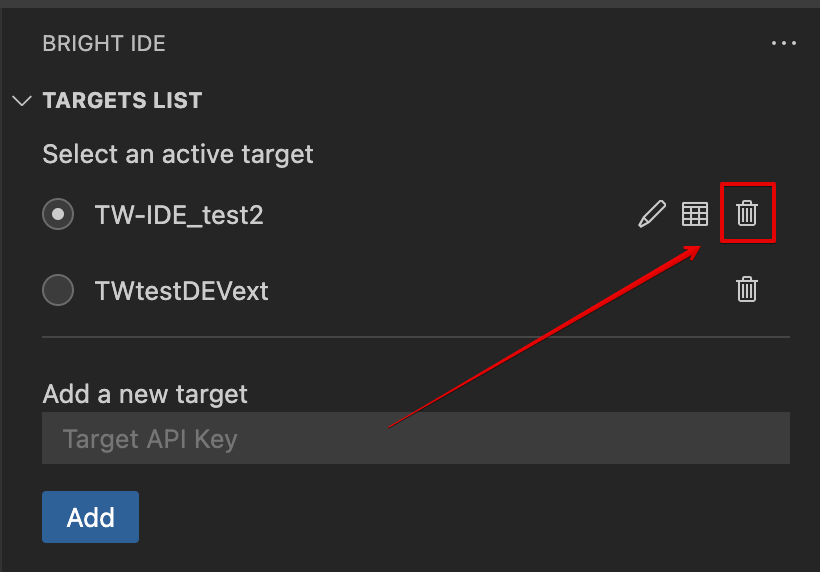
Done! The target has been deleted.
IDE extension settings (in VS Code)
To open the IDE extension settings in VS Code, do the following:
- Open VS Code and open the Command Palette (use
CMD+SHIFT+Pfor macOS orCTRL+SHIFT+Pfor Windows) - Start typing
Preferences: Open Settings (UI)and open it - Type
brightin the search field to filter settings
Bright IDE extension provides the following list of settings:
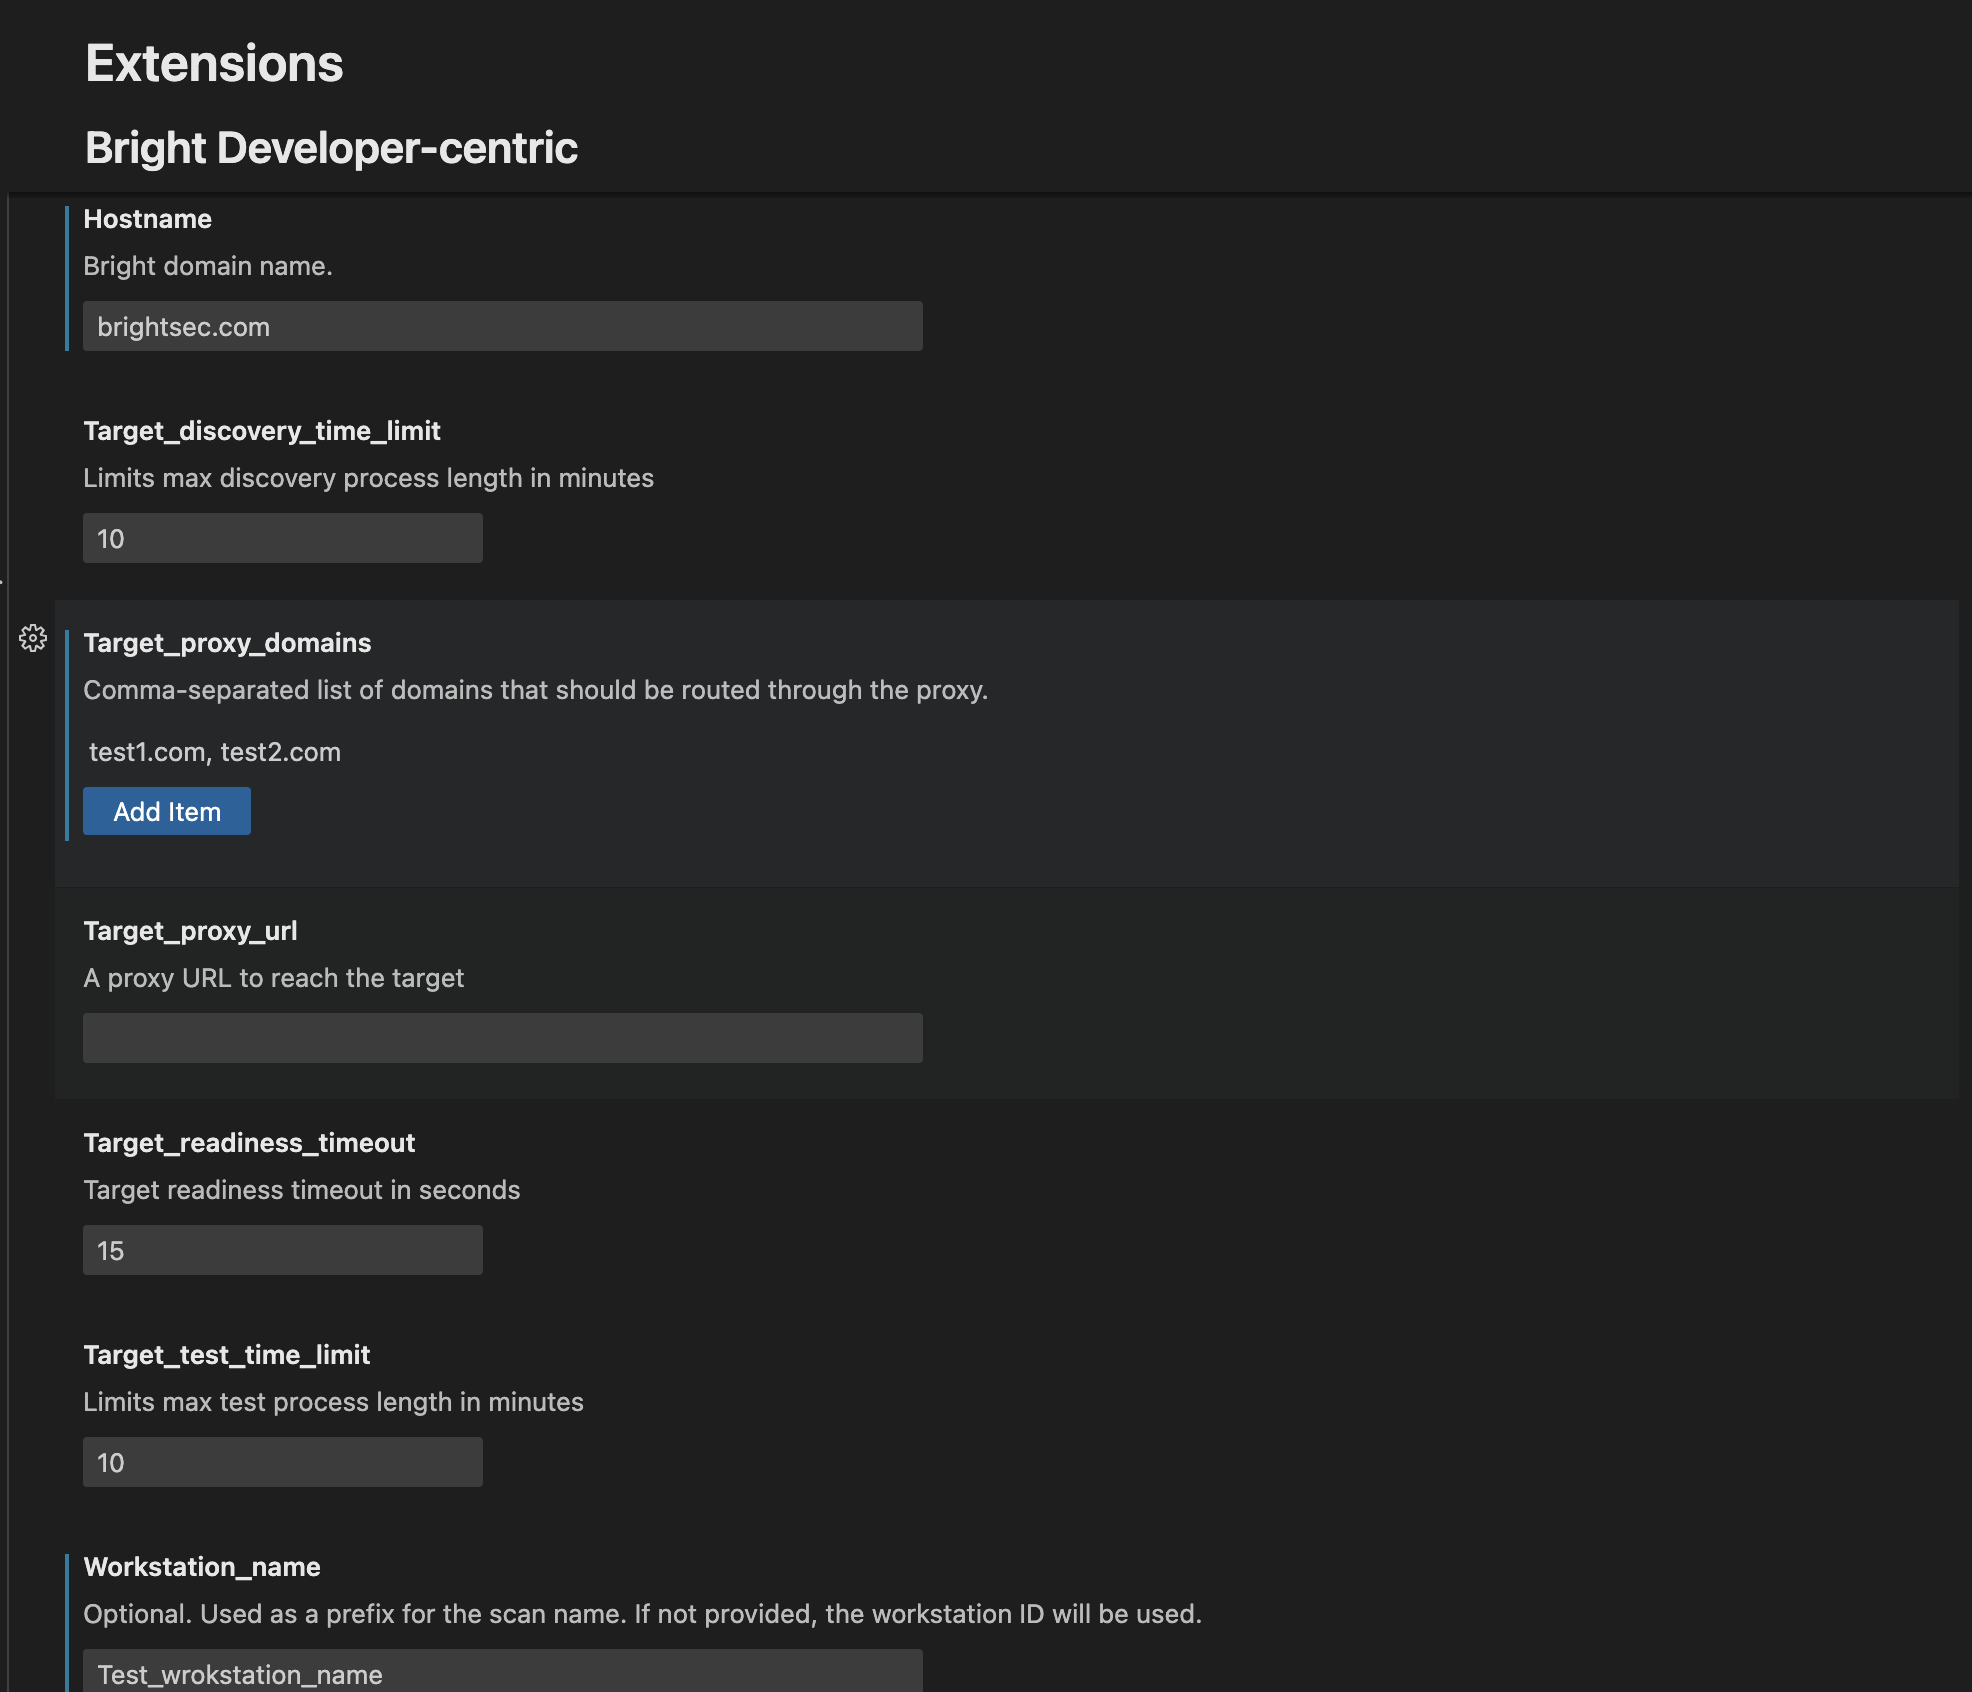
After you have finished changing the settings, you should restart the VS Code to apply the changes.
Be careful with editing these parameters; it can strongly affect the scan duration and results.
IDE Security Testing
Background Mapping and Testing
Use these shortcuts to open the Command Palette:
- MacOS:
Command + Shift + P - Windows:
Control + Shift + P
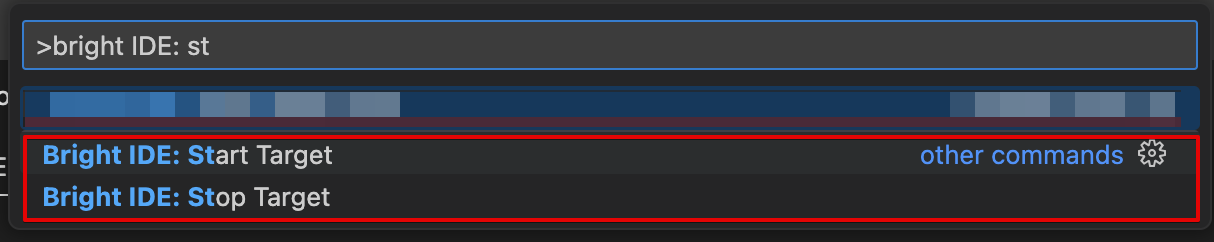
Use these commands to interact with the extension manually:
- Start Target - Starts the target defined locally, according to the start command.
- Stop Target - Stops the target defined locally by using the stop command if provided; if not, kills the process.
Review of Scan Results + Retest
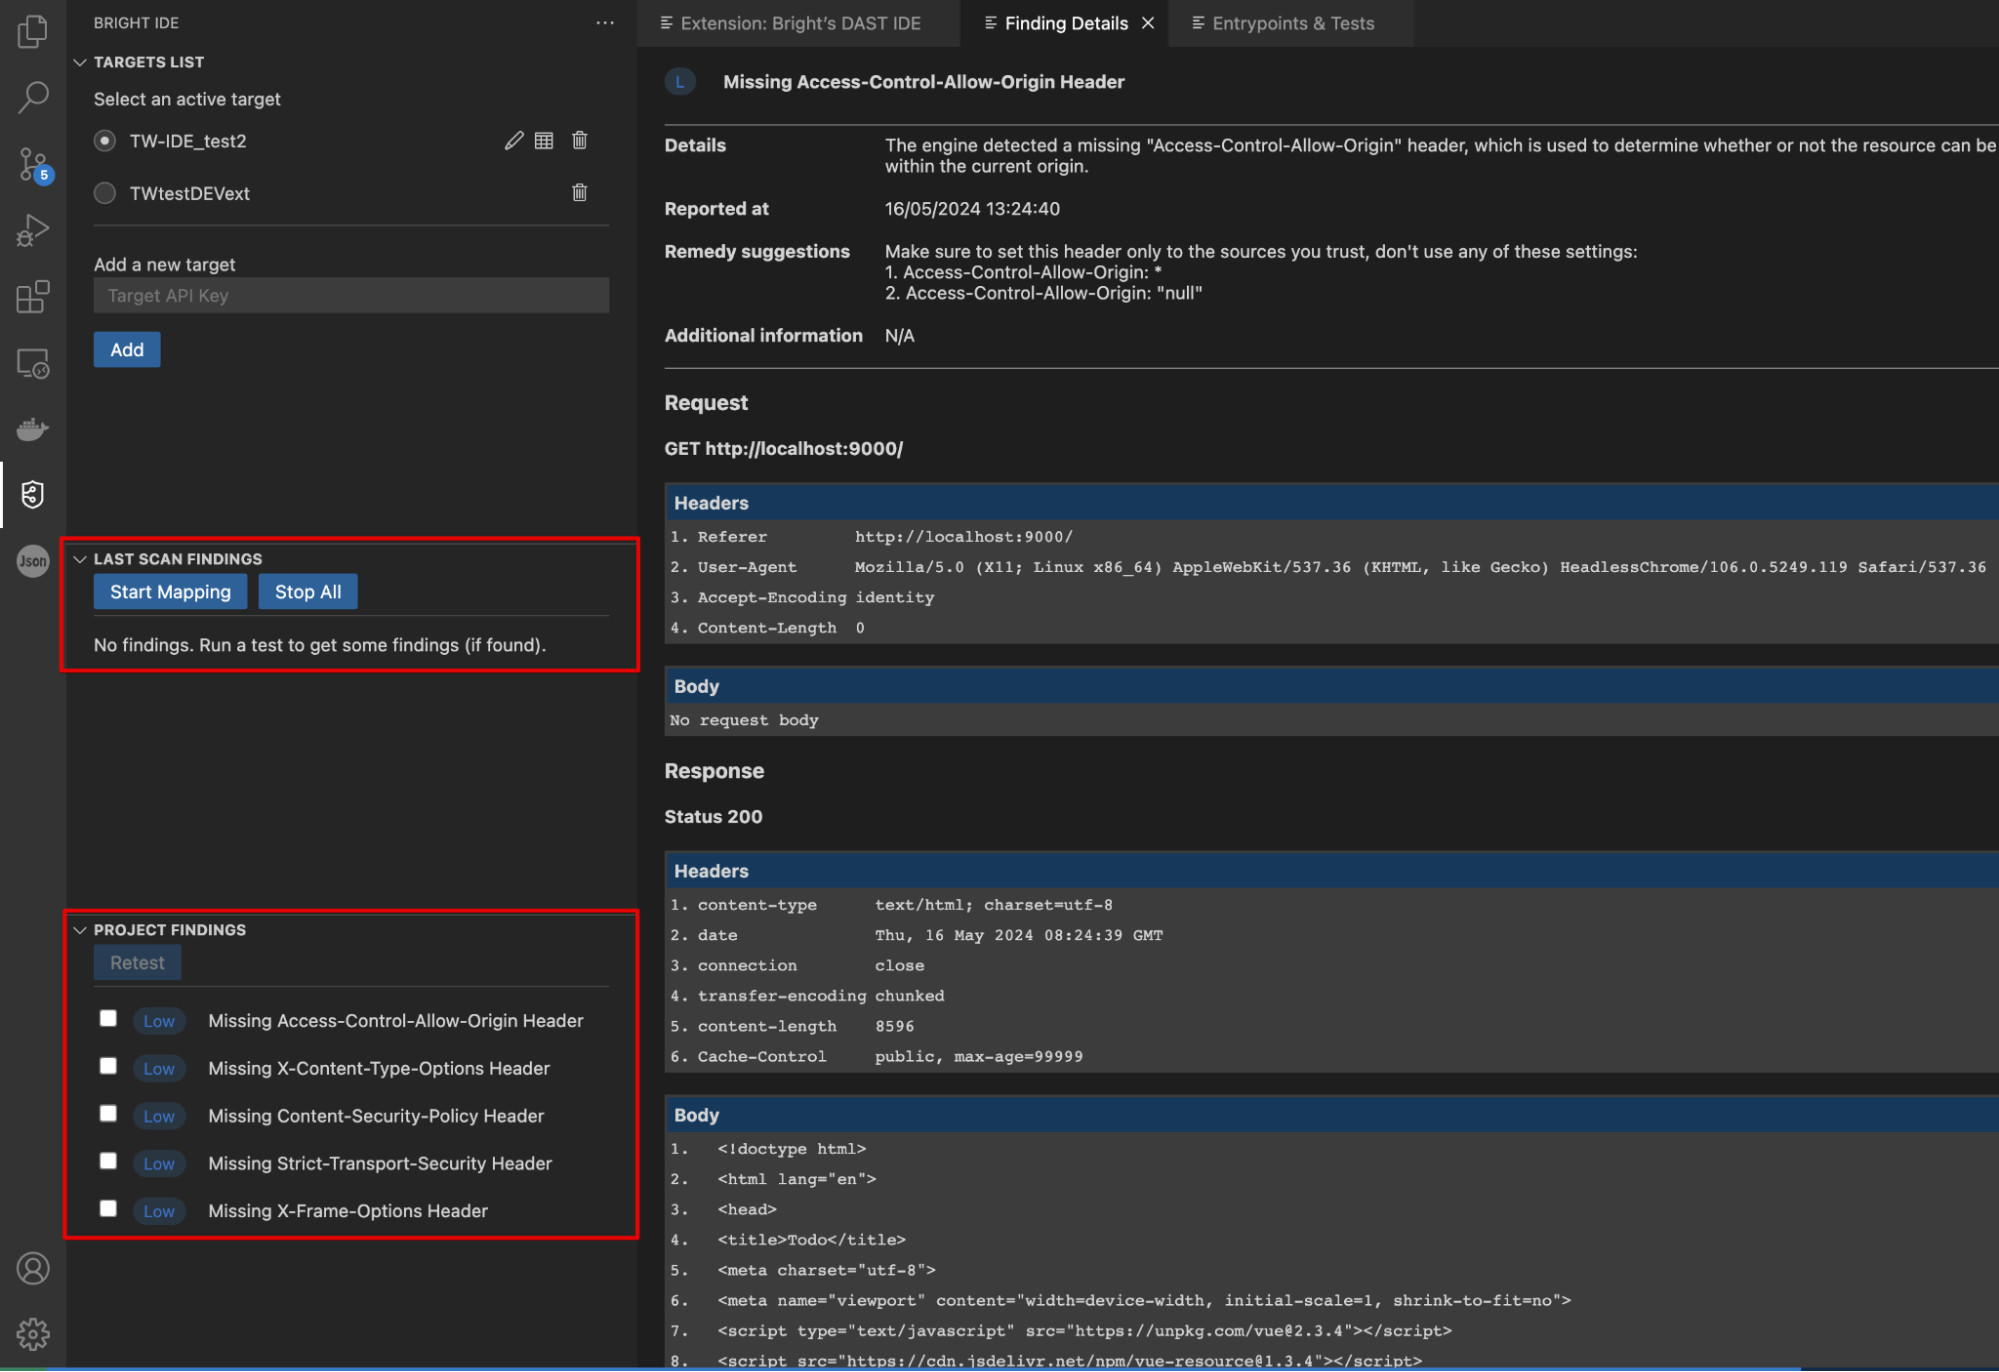
Within VS Code, the extension summarizes all findings and their severities from a test.
Findings are displayed during the scan as they are being found and will appear on the Last Scan Findings panel. Also, the Dev-Centric extension allows a developer to observe a list of all Project findings from any IDE extension connected to the project.
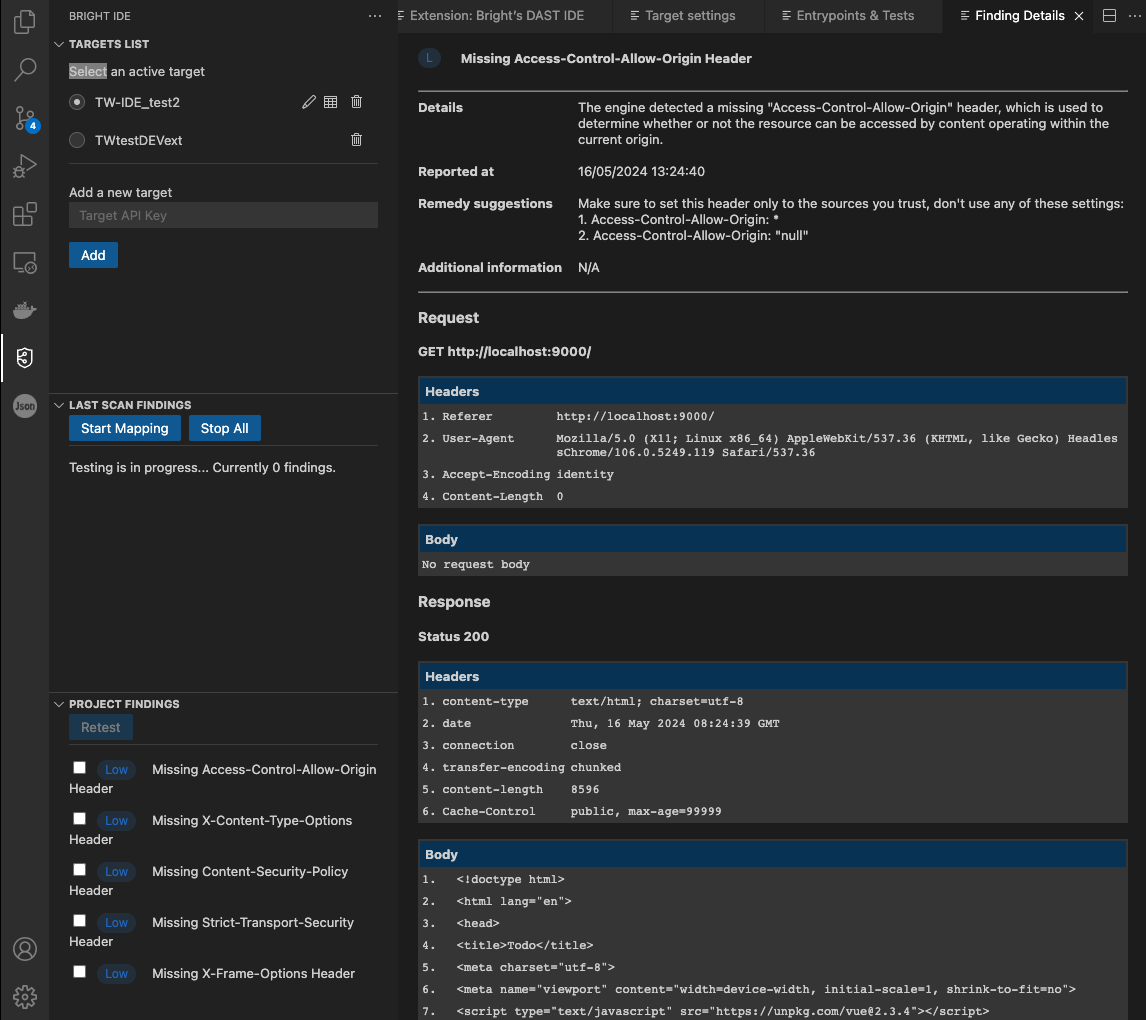
To open a Finding details page, select a finding to view more details. This page consists of the following parts:
- Details
- Reported at
- Remedy suggestions
- Additional information
- Request
- Response
How to work with Swagger / Postman collection
Users can work with a specific Swagger file or a local Postman collection.
Once a local file path or a publicly accessible URL is provided and the Save button is clicked, the extension will process the API Entrypoints from the provided file. These Entrypoints will be shown in the Entrypoints table for a user to select from.
To ensure that the specified upload file will be correctly read and processed, follow these rules:
- OpenAPI/Swagger Schema Validation Checklist
- Specify a Target Server (Host)
- OpenAPI 3+: Include the
serversproperty. Example:"servers": [ {"url": "https://development.gigantic-server.com/v1", "description": "Development server"}, {"url": "https://staging.gigantic-server.com/v1", "description": "Staging server"}, {"url": "https://api.gigantic-server.com/v1", "description": "Production server"} ] - Swagger 2: Include the
hostproperty. - Multiple Servers: List the primary server first.
- OpenAPI 3+: Include the
- Parameter Values
- Ensure all parameters have values.
- Add values in the raw schema or Value fields in the smart view.
- Define Variable Substitutions (OAS 3)
- Specify substitutions for variables.
- Specify a Target Server (Host)
- Postman Collection Validation Checklist
- URL Specification
- Ensure the URL item is properly specified. Example:
{ "url": { "raw": "{{url}}/.well-known/openid-configuration?client_id={{clientId}}", "host": ["{{url}}"], "path": [".well-known", "openid-configuration"], "query": [ {"key": "client_id", "value": "{{clientId}}"} ] } } - Avoid incomplete URL structures. Example of incorrect URL:
"url": {"raw": "{{url}}/.well-known/openid-configuration?client_id={{clientId}}"}
- Ensure the URL item is properly specified. Example:
- Ensure every environmental variable has a value.
- Use dynamic variables to generate random values per request.
"variable": [
  {"key": "batchResultId", "value": "{{$guid}}"}
]
- URL Specification
How to manage Entrypoints
Using the Bright IDE Extension, users can select existing Entrypoints from the Bright project for local use or add new ones. Once an app is crawled publicly, the results are shared across local environments. To start scanning a local web app instantly, reuse the public app’s entrypoints.
Select existing ones
To select existing Entrypoints, do the following:
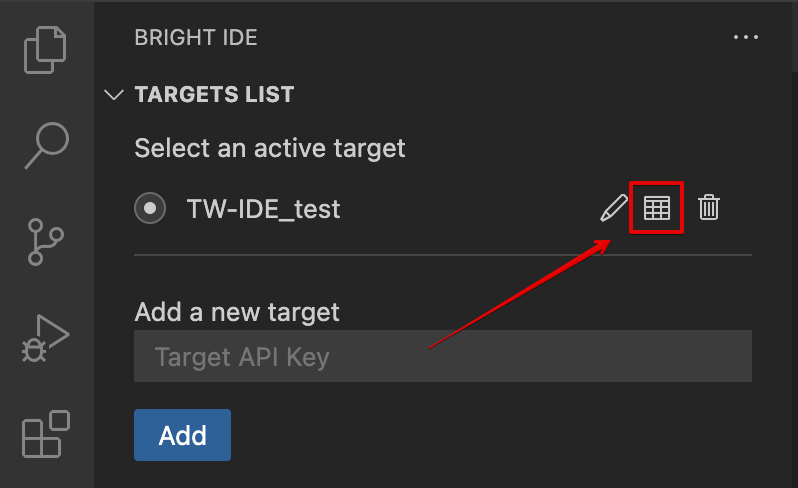
-
Click on the icon near the list of targets:

-
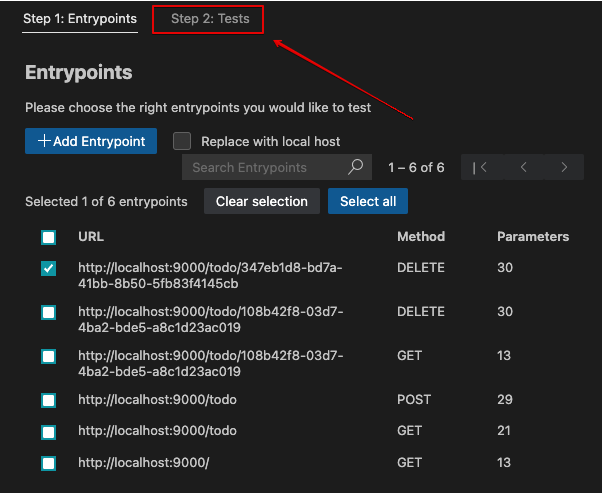
Select at least one Entrypoint from the Step 1: Entrypoints tab, and click on the Step 2: Tests tab to proceed:
-
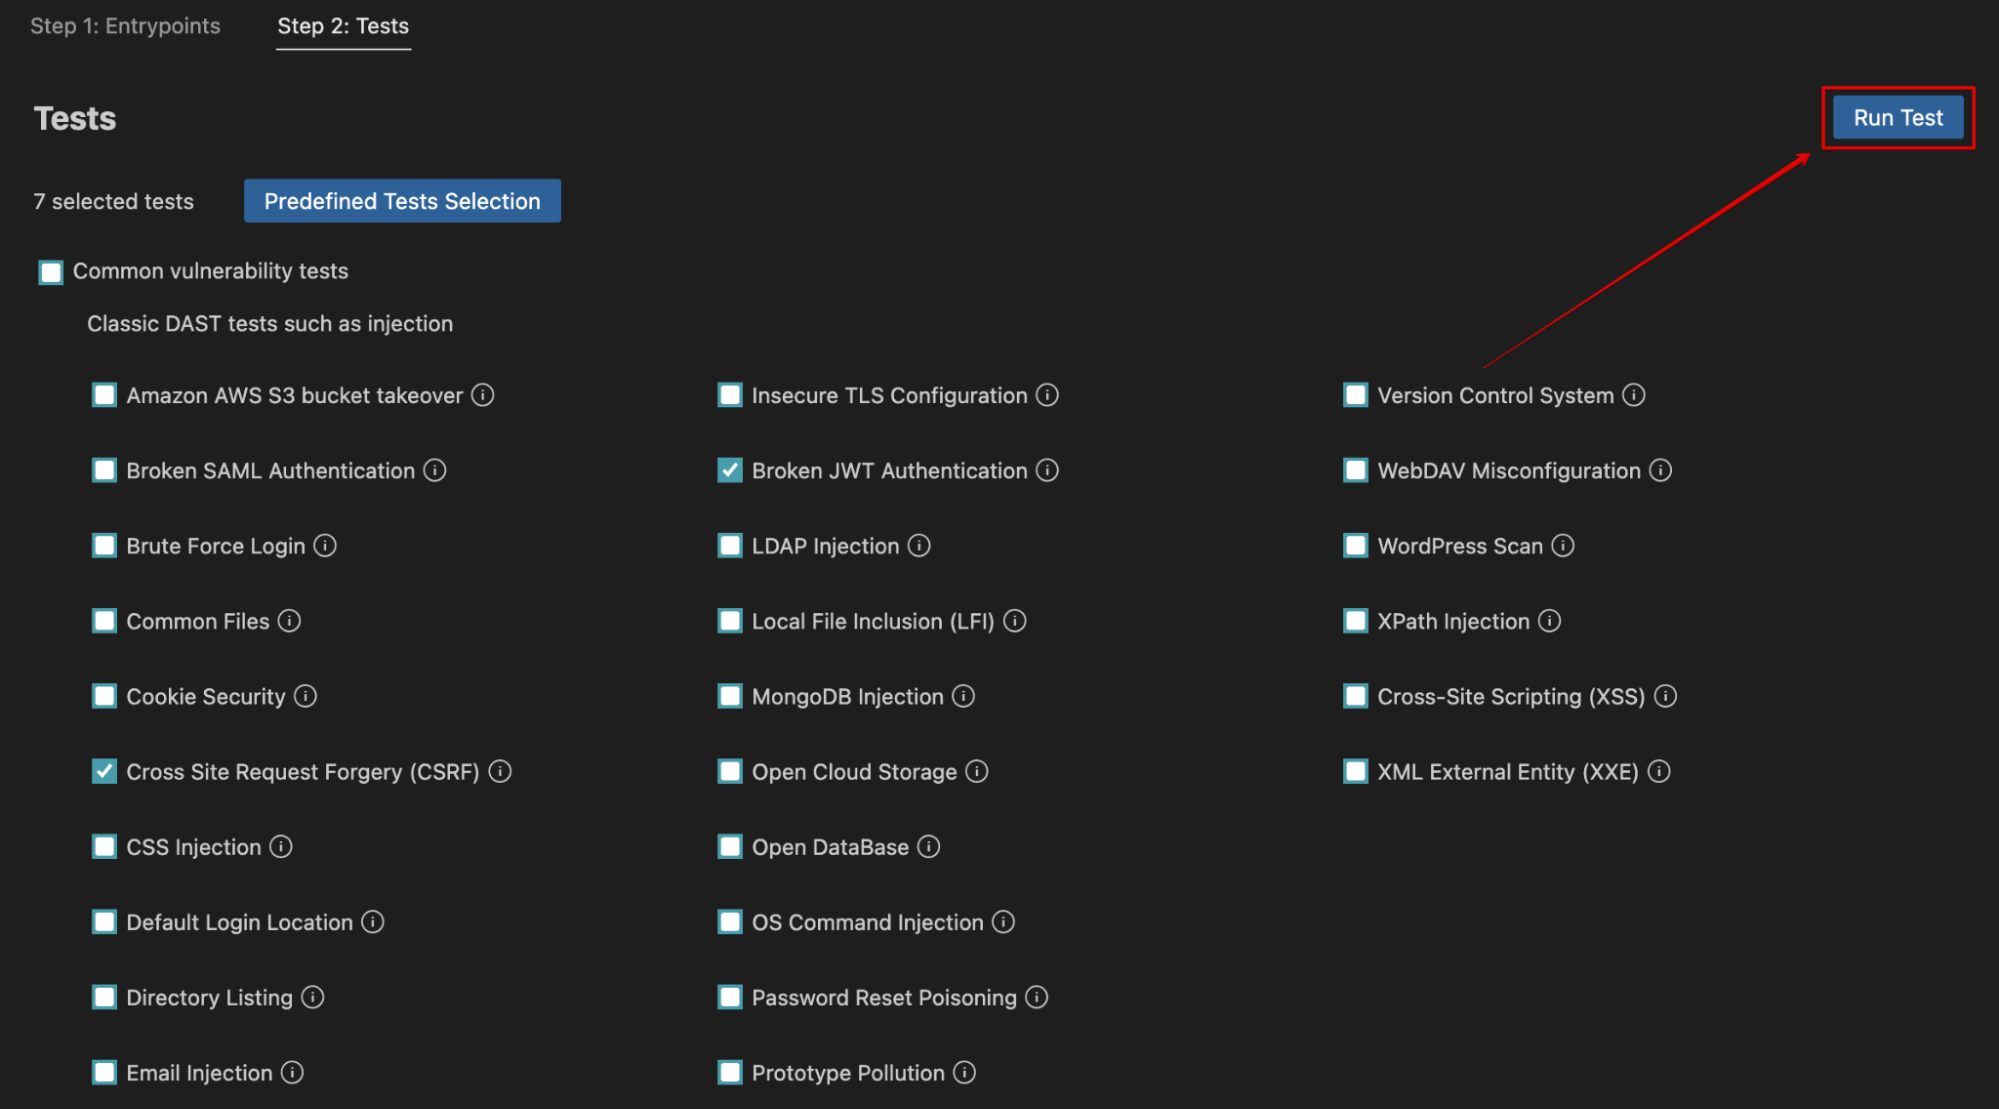
Select relevant tests from the list manually or click the Predefined Tests Selection to selected in the project setting phase predefined tests for this target.
-
Click Run Test to proceed.
-
You'll see a notification informing you that the test has been started successfully. Findings are displayed during the scan as they are being found and will appear on the Last Scan Findings panel. Below this panel is the Project Findings panel, which contains all the findings of a project.
After editing the code, select an issue (or issues) from the list to retest the target and click Retest (available both for the Last Scan Findings and the Project Findings tables). This action focuses on the specific vulnerability of the exact entrypoint where it was found.
Add new Entrypoints
Ensure full coverage of your web app by manually adding new Entrypoints from the extension.
To add a new Entrypoint within the extension, do the following:
-
Click on the icon near the list of targets:
-
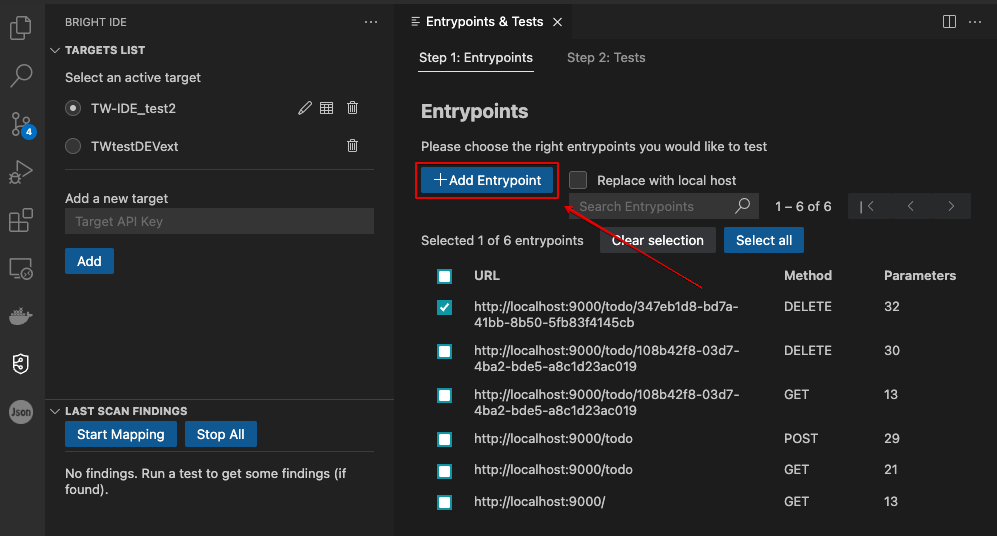
Click +Add Entrypoint:
-
-
Select a method and provide a URL to complete the process. Additionally, you can add headers and body, then click Save.
Reusing public URLs in local environments
In the Entrypoints & Tests dialog box, select Replace with local host to substitute previously discovered public URLs in your project with your local URLs.
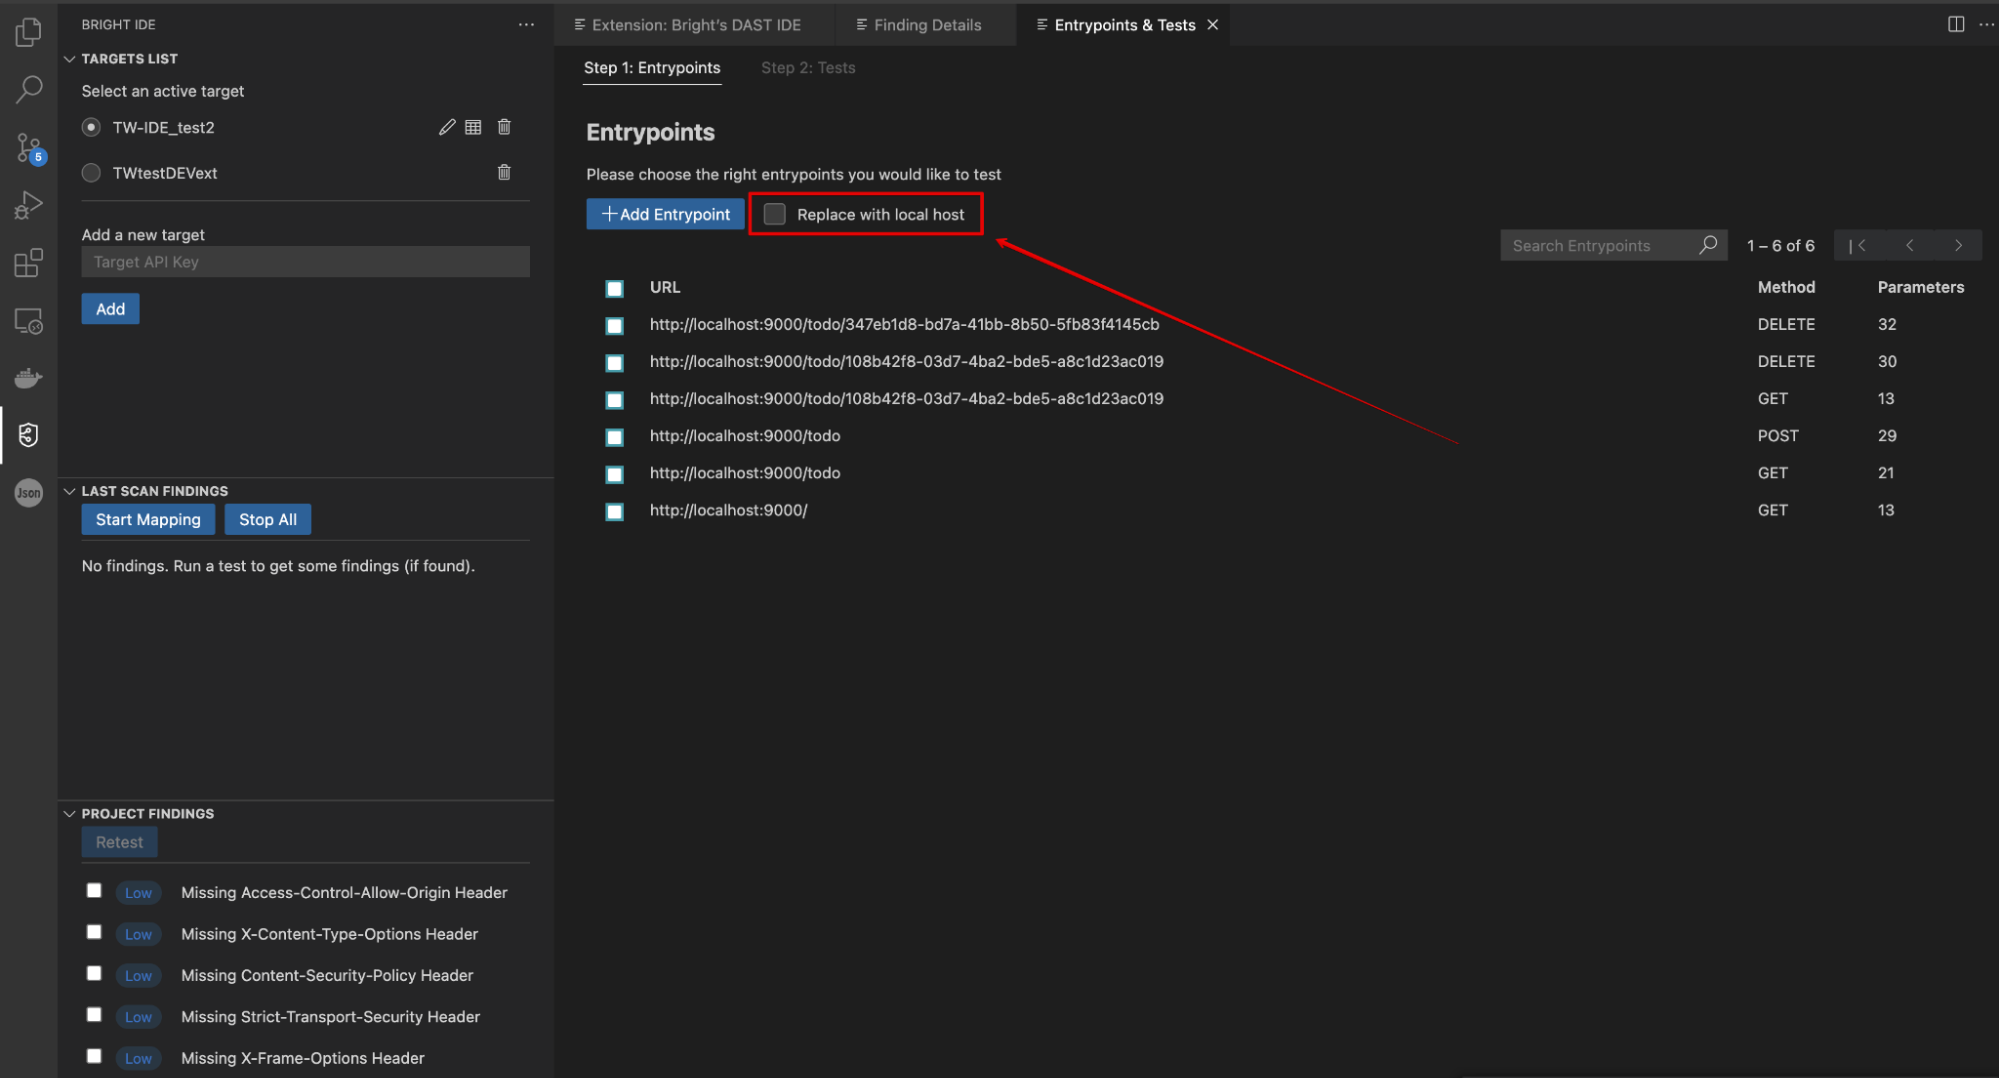
Example:
https://brokencrystals.com/api/products(public URL)
http://localhost:8090/api/products(local URL)
Updated about 1 year ago